Volvo 2011 Annual Report Download - page 106
Download and view the complete annual report
Please find page 106 of the 2011 Volvo annual report below. You can navigate through the pages in the report by either clicking on the pages listed below, or by using the keyword search tool below to find specific information within the annual report.-
 1
1 -
2
-
3
-
4
-
5
-
6
-
7
-
8
-
9
-
10
-
11
-
12
-
13
-
14
-
15
-
16
-
17
-
18
-
19
-
20
-
21
-
22
-
23
-
24
-
25
-
26
-
27
-
28
-
29
-
30
-
31
-
32
-
33
-
34
-
35
-
36
-
37
-
38
-
39
-
40
-
41
-
42
-
43
-
44
-
45
-
46
-
47
-
48
-
49
-
50
-
51
-
52
-
53
-
54
-
55
-
56
-
57
-
58
-
59
-
60
-
61
-
62
-
63
-
64
-
65
-
66
-
67
-
68
-
69
-
70
-
71
-
72
-
73
-
74
-
75
-
76
-
77
-
78
-
79
-
80
-
81
-
82
-
83
-
84
-
85
-
86
-
87
-
88
-
89
-
90
-
91
-
92
-
93
-
94
-
95
-
 96
96 -
 97
97 -
 98
98 -
 99
99 -
 100
100 -
 101
101 -
 102
102 -
 103
103 -
 104
104 -
 105
105 -
 106
106 -
 107
107 -
 108
108 -
 109
109 -
 110
110 -
 111
111 -
 112
112 -
 113
113 -
 114
114 -
 115
115 -
 116
116 -
117
-
118
-
119
-
120
-
121
-
122
-
123
-
124
-
125
-
126
-
127
-
128
-
129
-
130
-
131
-
132
-
133
-
134
-
135
-
136
-
137
-
138
-
139
-
140
-
141
-
142
-
143
-
144
-
145
-
146
-
147
-
148
-
149
-
150
-
151
-
152
-
153
-
154
-
155
-
156
-
157
-
158
-
159
-
160
-
161
-
162
-
163
-
164
-
165
-
166
 |
 |
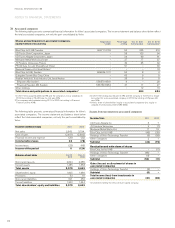
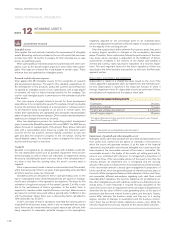
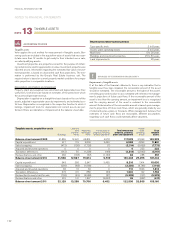
TANGIBLE ASSETS
13
NOTE
Tangible assets
Volvo applies the cost method for measurement of tangible assets. Bor-
rowing costs are included in the acquisition value of assets that necessar-
ily take more than 12 months to get ready for their intended use or sale,
so called qualifying assets.
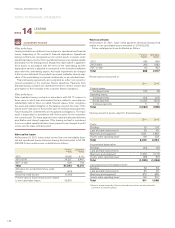
Investment properties are properties owned for the purpose of obtain-
ing rental income and/or appreciation in value. Investment properties are
reported at cost. Information regarding the estimated fair value of invest-
ment properties is based on discounted cash flow projections. The esti-
mation is performed by the Group’s Real Estate business unit. The
required return is based on current property market conditions for compa-
rable properties in comparable locations.
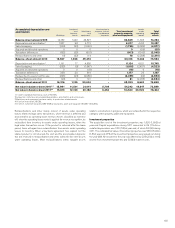
Depreciation, amortization and impairment
Property, plant and equipment are amortized and depreciated over their
useful lives. Useful lives are based on estimates of the period over which
the assets will generate revenue.
Depreciation is applied on a straight-line basis based on the cost of the
assets, adjusted in appropriate cases by impairments, and estimated use-
ful lives. Depreciation is recognized in the respective function to which it
belongs. Impairment tests for depreciable non-current assets are per-
formed if there are indications of impairment at the balance-sheet date.
Depreciation/amortization periods
Type-specific tools 2 to 8 years
Assets under operating leases 3 to 5 years
Machinery 5 to 20 years
Buildings and investment properties 25 to 50 years
Land improvements 20 years
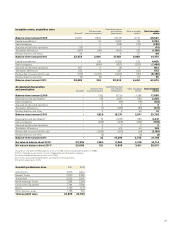
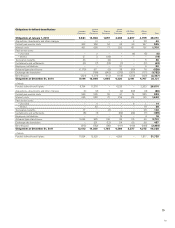
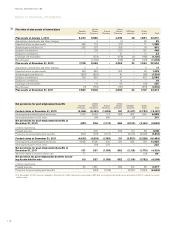
Tangible assets, acquisition costs
Buildings
Land and
land
improve-
ments
Machinery
and equip-
ment3
Construction in
progress, including
advance payments
Total investment
property, property,
plant and equipment
Assets
under
operating
leases
Total
tangible
assets
Balance-sheet amount 2009 31,859 12,641 68,851 4,578 117,929 31,993 149,922
Capital expenditures1617 119 3,806 2,446 6,988 4,893 11,881
Sales/scrapping (472) (105) (1,730) (7) (2,314) (5,459) (7,773)
Acquired and divested operations 0 0 0 0 0223 223
Translation differences (912) 50 (1,308) (148) (2,318) (2,843) (5,161)
Reclassifications and other 466 (138) 895 (1,160) 63 288 351
Balance-sheet amount 2010 31,558 12,567 70,514 5,709 120,348 29,095 149,443
Capital expenditures1548 266 3,947 3,455 8,216 7,414 15,630
Sales/scrapping (299) (88) (1,969) 0 (2,356) (4,786) (7,142)
Acquired and divested operations 36 10 64 0 110 1,503 1,613
Translation differences 373 411 889 (33) 1,640 122 1,762
Reclassified to assets held for sale (706) (49) (4,586) (57) (5,398) (131) (5,529)
Reclassifications and other 619 141 1,897 (2,622) 35 (652) (617)
Balance-sheet amount 2011 32,129 13,258 70,756 6,452 122,595 32,565 155,160
ACCOUNTING POLICIES
SOURCES OF ESTIMATION UNCERTAINTY
!
Impairment of tangible assets
If, at the date of the financial statements, there is any indication that a
tangible asset has been impaired, the recoverable amount of the asset
should be estimated. The recoverable amount is the higher of the asset’s
net selling price and its value in use, estimated with reference to manage-
ment’s projections of future cash flows. If the recoverable amount of the
asset is less than the carrying amount, an impairment loss is recognized
and the carrying amount of the asset is reduced to the recoverable
amount. Determination of the recoverable amount is based upon manage-
ment’s projections of future cash flows, which are generally made by use
of internal business plans or forecasts. While management believes that
estimates of future cash flows are reasonable, different assumptions
regarding such cash flows could materially affect valuations.
NOTES TO FINANCIAL STATEMENTS
FINANCIAL INFORMATION 2011
102