Volvo 2011 Annual Report Download - page 147
Download and view the complete annual report
Please find page 147 of the 2011 Volvo annual report below. You can navigate through the pages in the report by either clicking on the pages listed below, or by using the keyword search tool below to find specific information within the annual report.-
 1
1 -
2
-
3
-
4
-
5
-
6
-
7
-
8
-
9
-
10
-
11
-
12
-
13
-
14
-
15
-
16
-
17
-
18
-
19
-
20
-
21
-
22
-
23
-
24
-
25
-
26
-
27
-
28
-
29
-
30
-
31
-
32
-
33
-
34
-
35
-
36
-
37
-
38
-
39
-
40
-
41
-
42
-
43
-
44
-
45
-
46
-
47
-
48
-
49
-
50
-
51
-
52
-
53
-
54
-
55
-
56
-
57
-
58
-
59
-
60
-
61
-
62
-
63
-
64
-
65
-
66
-
67
-
68
-
69
-
70
-
71
-
72
-
73
-
74
-
75
-
76
-
77
-
78
-
79
-
80
-
81
-
82
-
83
-
84
-
85
-
86
-
87
-
88
-
89
-
90
-
91
-
92
-
93
-
94
-
95
-
96
-
97
-
98
-
99
-
100
-
101
-
102
-
103
-
104
-
105
-
106
-
107
-
108
-
109
-
110
-
111
-
112
-
113
-
114
-
115
-
116
-
117
-
118
-
119
-
120
-
121
-
122
-
123
-
124
-
125
-
126
-
127
-
128
-
129
-
130
-
131
-
132
-
133
-
134
-
135
-
136
-
 137
137 -
 138
138 -
 139
139 -
 140
140 -
 141
141 -
 142
142 -
 143
143 -
 144
144 -
 145
145 -
 146
146 -
 147
147 -
 148
148 -
 149
149 -
 150
150 -
 151
151 -
 152
152 -
 153
153 -
 154
154 -
 155
155 -
 156
156 -
 157
157 -
158
-
159
-
160
-
161
-
162
-
163
-
164
-
165
-
166
 |
 |

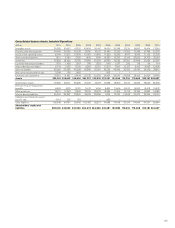
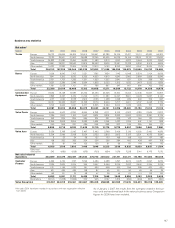
Consolidated balance sheets, Industrial Operations
SEK M 2011 2010 2009 2008 2007 2006 2005 2004 2003 2002 2001
Intangible assets 39,385 40,613 41,532 43,909 36,441 19,054 20,348 17,570 16,662 16,919 17,366
Property, plant and equipment 54,446 54,169 55,208 57,185 47,132 30,493 31,330 27,260 27,248 27,789 30,370
Assets under operating leases 16,749 13,217 13,539 16,967 13,850 11,822 10,260 8,477 8,976 11,155 15,020
Shares and participations 1,871 2,080 2,025 1,935 2,189 16,565 10,357 10,116 30,022 34,750 35,145
Inventories 43,828 38,956 35,765 54,084 43,264 33,893 33,583 28,291 25,848 27,564 30,557
Customer-financing receivables 1,702 1,428 1,367 975 1,233 1,193 1,377 230 118 99 114
Interest-bearing receivables 6,734 11,153 8,010 6,056 13,701 13,214 7,691 12,127 9,413 8,495 12,426
Other receivables 59,062 52,358 49,008 60,586 55,970 43,335 43,992 36,535 33,079 34,256 38,815
Non-current assets held for sale 9,348 136 1,692 – – 805 – – – – –
Cash and cash equivalents 35,951 31,491 37,404 22,575 30,026 29,907 36,047 34,628 28,102 24,154 24,874
Assets 269,076 245,602 245,550 264,272 243,806 200,281 194,985 175,234 179,468 185,181 204,687
Shareholders’ equity 76,682 66,101 58,485 75,046 75,129 87,188 78,760 70,155 72,636 78,525 85,576
Provision for post-employment
benefits 6,635 7,478 8,021 11,677 9,746 8,661 11,966 14,677 15,264 16,218 14,632
Other provisions 19,101 17,240 17,456 27,015 25,372 19,385 17,164 14,115 12,792 13,893 14,085
Interest-bearing liabilities 55,394 59,857 78,890 46,749 38,286 9,779 13,097 13,968 24,677 22,494 29,710
Liabilities associated with assets
held for sale 4,716 135 272 – – 280 – – – – –
Other liabilities 106,548 94,791 82,426 103,785 95,273 74,988 73,998 62,319 54,099 54,051 60,684
Shareholders’ equity and
liabilities 269,076 245,602 245,550 264,272 243,806 200,281 194,985 175,234 179,468 185,181 204,687
143