Volvo 2011 Annual Report Download - page 150
Download and view the complete annual report
Please find page 150 of the 2011 Volvo annual report below. You can navigate through the pages in the report by either clicking on the pages listed below, or by using the keyword search tool below to find specific information within the annual report.-
 1
1 -
2
-
3
-
4
-
5
-
6
-
7
-
8
-
9
-
10
-
11
-
12
-
13
-
14
-
15
-
16
-
17
-
18
-
19
-
20
-
21
-
22
-
23
-
24
-
25
-
26
-
27
-
28
-
29
-
30
-
31
-
32
-
33
-
34
-
35
-
36
-
37
-
38
-
39
-
40
-
41
-
42
-
43
-
44
-
45
-
46
-
47
-
48
-
49
-
50
-
51
-
52
-
53
-
54
-
55
-
56
-
57
-
58
-
59
-
60
-
61
-
62
-
63
-
64
-
65
-
66
-
67
-
68
-
69
-
70
-
71
-
72
-
73
-
74
-
75
-
76
-
77
-
78
-
79
-
80
-
81
-
82
-
83
-
84
-
85
-
86
-
87
-
88
-
89
-
90
-
91
-
92
-
93
-
94
-
95
-
96
-
97
-
98
-
99
-
100
-
101
-
102
-
103
-
104
-
105
-
106
-
107
-
108
-
109
-
110
-
111
-
112
-
113
-
114
-
115
-
116
-
117
-
118
-
119
-
120
-
121
-
122
-
123
-
124
-
125
-
126
-
127
-
128
-
129
-
130
-
131
-
132
-
133
-
134
-
135
-
136
-
137
-
138
-
139
-
 140
140 -
 141
141 -
 142
142 -
 143
143 -
 144
144 -
 145
145 -
 146
146 -
 147
147 -
 148
148 -
 149
149 -
 150
150 -
 151
151 -
 152
152 -
 153
153 -
 154
154 -
 155
155 -
 156
156 -
 157
157 -
 158
158 -
 159
159 -
 160
160 -
161
-
162
-
163
-
164
-
165
-
166
 |
 |

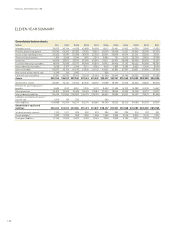
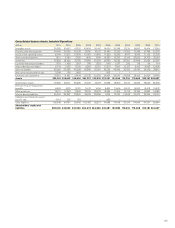
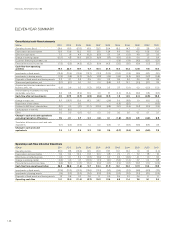
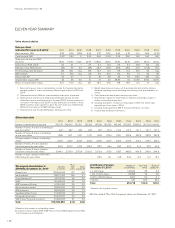
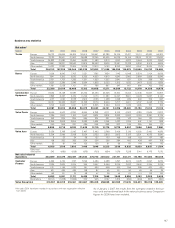
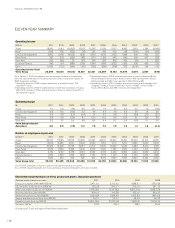
ELEVEN-YEAR SUMMARY
Volvo share statistics
Data per share
(adjusted for issues and splits)12011 2010 2009 2008 2007 2006 2005 2004 2003 2002 2001
Basic earnings, SEK18.75 5.36 (7.26) 4.90 7.37 8.03 6.44 4.72 0.14 0.66 (0.70)
Cash dividend, SEK 3.0010 2.50 0 2.00 5.50 10.0093.35 2.50 1.60 1.60 1.60
Share price at year-end, SEK
(B share) 75.30 118.50 61.45 42.90 108.50 90.70 74.90 52.70 43.70 28.40 35.20
Direct return, % (B share)24.0 2.1 – 4.7 5.1 11.0 4.5 4.7 10.585.6 4.5
Effective return, % (B share)3(34) 97 43 (59) 25.7 39.8 48.5 25.5 71.2 (14.8) 17.6
Price/earnings ratio (B share)48.6 22.1 neg 8.8 14.7 11.3 11.6 11.2 310 43 neg
EBIT multiple55.1 12.0 neg 3.6 9.7 10.3 9.3 9.2 14 23 25
Payout ratio, %634 47 – 41 75 62 52 53 1,143 242 neg
Shareholders’ equity, SEK742 36 33 41 41 43 38.80 34 34.60 37.40 40.60
Return on shareholders' equity 23.1 16.0 neg 12.1 18.1 19.6 17.8 13.9 0.4 1.7 neg
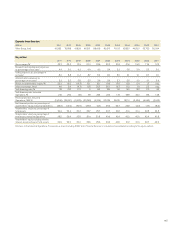
Other share data
2011 2010 2009 2008 2007 2006 2005 2004 2003 2002 2001
Number of shareholders at year-end 251,715 240,043 233,311 220,192 197,519 183,735 195,442 202,300 208,500 211,000 214,000
Number of Series A shares outstanding at
year-end, million 643 657 657 657 657 131.4 131.4 131.5 131.7 131.7 131.7
Number of Series B shares outstanding
at year-end, million 1,385 1,371 1,371 1,371 1,369 273.4 273.1 278.6 287.8 287.8 287.8
Average number of shares outstanding,
million 2,027 2,027 2,027 2,027 2,025 404.7 405.2 418.5 419.4 419.4 422.4
Number of Series A shares traded in
Stockholm during the year, million 130.5 203.2 147.0 308.0 172.3 56.4 39.3 42.0 31.4 27.3 40.3
Number of Series B shares traded in
Stockholm during the year, million 2,944.1 2,272.4 2,713.9 3,130.0 2,712.4 617.0 518.7 498.0 404.8 349.4 344.4
Number of shares traded in ADR, NAS-
DAQ during the year, million – ———113.5 14.1 19.8 24.0 10.4 11.0 15.0
1 Basic earnings per share is calculated as income for the period divided by
average number of shares outstanding. Reporting according to IFRS from
2004.
2 Proposed dividend in SEK per share divided by share price at year-end.
3 Share price at year-end, including proposed dividend during the year,
divided by share price at beginning of the year, (2000 includes premium in
connection with repurchase, 2003 includes distribution of shares in Ainax,
2006 includes a share split 6:1 in which the sixth share was redeemed by
AB Volvo for an amount of SEK 5.00 per share).
4 Share price at year-end divided by basic earnings per share.
5 Market value at year-end minus net financial position and minority interests
divided by operating income excluding restructuring costs and revaluation of
shares.
6 Cash dividend divided by basic earnings per share.
7 Shareholders’ equity for shareholders in AB Volvo divided by number of
shares outstanding at year-end.
8 Including distribution of shares in Ainax equal to SEK 3.01 (share-split
adjusted) per Volvo share in 2004.
9 Including extra payment of SEK 5 through redemption of shares.
10 Proposed by the Board of Directors.
The largest shareholders in
AB Volvo, December 31, 20111Number
of shares
% of
total
votes Share
capital, %
Renault s.a.s. 138,604,945 17.7 6.8
Industrivärden 122,811,457 15.6 6.1
Violet Partners LP 43,727,400 5.6 2.2
SHB236,405,612 4.7 1.8
AMF Insurance & Funds 61,051,900 3.9 3.0
Alecta (pension funds) 87,650,000 3.8 4.3
AFA Insurance 26,024,563 3.3 1.3
Swedbank Robur Funds 81,098,942 2.7 4.0
Norwegian Government 63,945,595 2.4 3.2
SEBFunds/Trygg Life Insurance 44,469,536 2.1 2.2
Total 705,789,950 61.8 34.8
Distribution of shares,
December 31, 20111Number of
shareholders % of total
votes1Share of
capital, %1
1–1,000 shares 190,646 2.8 2.4
1,001–10,000 shares 56,088 7.6 5.5
10,001–100,000 shares 4,434 5.0 3.1
100,001– 547 84.6 89.0
Total 251,715 100.0 100.0
1 Based on the number of outstanding shares.
2 Comprises shares held by SHB, SHB Pension Fund, SHB Employee Fund, SHB
Pensionskassa and Oktogonen.
1 Based on all registered shares.
AB Volvo held 4.7% of the Company’s shares on December 31, 2011.
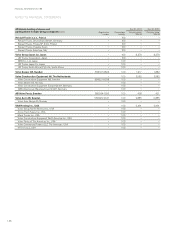
FINANCIAL INFORMATION 2011
146