Volvo 2011 Annual Report Download - page 136
Download and view the complete annual report
Please find page 136 of the 2011 Volvo annual report below. You can navigate through the pages in the report by either clicking on the pages listed below, or by using the keyword search tool below to find specific information within the annual report.-
 1
1 -
2
-
3
-
4
-
5
-
6
-
7
-
8
-
9
-
10
-
11
-
12
-
13
-
14
-
15
-
16
-
17
-
18
-
19
-
20
-
21
-
22
-
23
-
24
-
25
-
26
-
27
-
28
-
29
-
30
-
31
-
32
-
33
-
34
-
35
-
36
-
37
-
38
-
39
-
40
-
41
-
42
-
43
-
44
-
45
-
46
-
47
-
48
-
49
-
50
-
51
-
52
-
53
-
54
-
55
-
56
-
57
-
58
-
59
-
60
-
61
-
62
-
63
-
64
-
65
-
66
-
67
-
68
-
69
-
70
-
71
-
72
-
73
-
74
-
75
-
76
-
77
-
78
-
79
-
80
-
81
-
82
-
83
-
84
-
85
-
86
-
87
-
88
-
89
-
90
-
91
-
92
-
93
-
94
-
95
-
96
-
97
-
98
-
99
-
100
-
101
-
102
-
103
-
104
-
105
-
106
-
107
-
108
-
109
-
110
-
111
-
112
-
113
-
114
-
115
-
116
-
117
-
118
-
119
-
120
-
121
-
122
-
123
-
124
-
125
-
 126
126 -
 127
127 -
 128
128 -
 129
129 -
 130
130 -
 131
131 -
 132
132 -
 133
133 -
 134
134 -
 135
135 -
 136
136 -
 137
137 -
 138
138 -
 139
139 -
 140
140 -
 141
141 -
 142
142 -
 143
143 -
 144
144 -
 145
145 -
 146
146 -
147
-
148
-
149
-
150
-
151
-
152
-
153
-
154
-
155
-
156
-
157
-
158
-
159
-
160
-
161
-
162
-
163
-
164
-
165
-
166
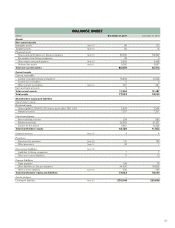
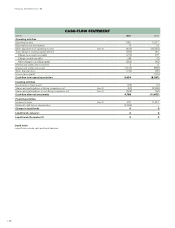
 |
 |
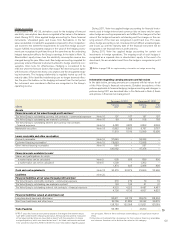
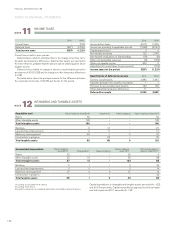
2011 2010
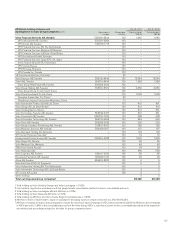
Current taxes – (176)
Deferred taxes (597) (1,055)
Total income taxes (597) (1,231)
Current taxes relate to prior periods.
Deferred taxes relate to estimated tax on the change in tax-loss carry-
forwards and temporary differences. Deferred tax assets are reported to
the extent that it is probable that the amount can be utilized against future
taxable income.
Deferred taxes related to change in tax-loss carryforwards amount to
an expense of 602 (1,063) and to changes in other temporary differences
to 5 (8).
The table below shows the principal reasons for the difference between
the corporate income tax of 26.3% and the tax for the period.
2011 2010
Income before taxes 6,078 11,559
Income tax according to applicable tax rate (1,598) (3,040)
Capital gains/losses 0 0
Non-taxable dividends 723 2,146
Non-taxable revaluations of shareholdings (16) (8)
Other non-deductible expenses (6) (156)
Other non-taxable income 300 3
Adjustment of current taxes for prior periods – (176)
Income taxes for the period (597) (1,231)
Specification of deferred tax assets 2011 2010
Tax-loss carryforwards 2,885 3,487
Valuation allowancefor doubtful receivables 1 1
Provision for post-employment benefits 163 169
Other deductible temporary differences 11 –
Deferred tax assets 3,060 3,657
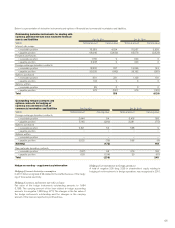
Acquisition cost Value in balance sheet 2010 Investments Sales/scrapping Value in balance sheet 2011
Rights 52 – – 52
Other intangible assets 138 – – 138
Total intangible assets 190 – – 190
Buildings 6 21 – 27
Land and land improvements 3 11 – 14
Machinery and equipment 46 1 0 47
Construction in progress – 32 – 32
Total tangible assets 55 65 0 120
Accumulated depreciation Value in balance
sheet 20101Depreciation2Sales/scrapping Value in balance
sheet 2011 Net carrying value in
balance sheet 20113
Rights 52 – – 52 0
Other intangible assets 35 15 – 50 88
Total intangible assets 87 15 – 102 88
Buildings 2 1 – 3 24
Land and land improvements 0 0 – 0 14
Machinery and equipment 37 0 0 37 10
Construction in progress – – – – 32
Total tangible assets 39 1 0 40 80
1 Including accumulated write-downs.
2 Including write-downs.
3 Acquisition value, less accumulated depreciation, amortization and write-downs.
Capital expenditures in intangible and tangible assets amounted to – (22)
and 65 (1) respectively. Capital expenditures approved but not yet imple-
mented at year-end 2011 amounted to 1 (0).
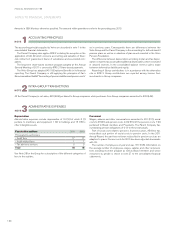
INCOME TAXES
11
NOTE
INTANGIBLE AND TANGIBLE ASSETS
12
NOTE
FINANCIAL INFORMATION 2011
132
NOTES TO FINANCIAL STATEMENTS