Volvo 2011 Annual Report Download - page 120
Download and view the complete annual report
Please find page 120 of the 2011 Volvo annual report below. You can navigate through the pages in the report by either clicking on the pages listed below, or by using the keyword search tool below to find specific information within the annual report.-
 1
1 -
2
-
3
-
4
-
5
-
6
-
7
-
8
-
9
-
10
-
11
-
12
-
13
-
14
-
15
-
16
-
17
-
18
-
19
-
20
-
21
-
22
-
23
-
24
-
25
-
26
-
27
-
28
-
29
-
30
-
31
-
32
-
33
-
34
-
35
-
36
-
37
-
38
-
39
-
40
-
41
-
42
-
43
-
44
-
45
-
46
-
47
-
48
-
49
-
50
-
51
-
52
-
53
-
54
-
55
-
56
-
57
-
58
-
59
-
60
-
61
-
62
-
63
-
64
-
65
-
66
-
67
-
68
-
69
-
70
-
71
-
72
-
73
-
74
-
75
-
76
-
77
-
78
-
79
-
80
-
81
-
82
-
83
-
84
-
85
-
86
-
87
-
88
-
89
-
90
-
91
-
92
-
93
-
94
-
95
-
96
-
97
-
98
-
99
-
100
-
101
-
102
-
103
-
104
-
105
-
106
-
107
-
108
-
109
-
 110
110 -
 111
111 -
 112
112 -
 113
113 -
 114
114 -
 115
115 -
 116
116 -
 117
117 -
 118
118 -
 119
119 -
 120
120 -
 121
121 -
 122
122 -
 123
123 -
 124
124 -
 125
125 -
 126
126 -
 127
127 -
 128
128 -
 129
129 -
 130
130 -
131
-
132
-
133
-
134
-
135
-
136
-
137
-
138
-
139
-
140
-
141
-
142
-
143
-
144
-
145
-
146
-
147
-
148
-
149
-
150
-
151
-
152
-
153
-
154
-
155
-
156
-
157
-
158
-
159
-
160
-
161
-
162
-
163
-
164
-
165
-
166
 |
 |
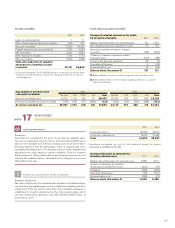
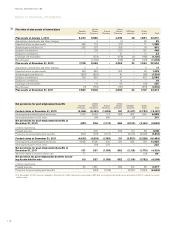
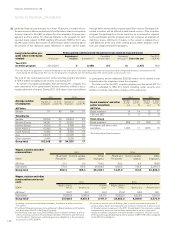
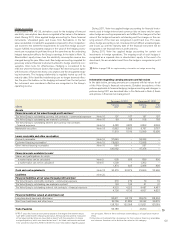
Current liabilities
Balance sheet amounts for loans were as follows:
2011 2010
Bank loans 12,639 12,261
Other loans 31,883 27,340
Total144,522 39,601
1 Of which loans raised to finance the credit portfolio of the customer financing
operations amount to 31,844 (29,690) and financial derivatives at fair value
1,362 (458).
Bank loans include current maturities of non-current loans 5,803 (3,246).
Other loans include current maturities of non-current loans, 17,681
(22,007), and commercial paper, 8,393 (1,416). Non-interest-bearing
current liabilities accounted for 99,152 (84,457), or 69% (68) of the Group’s
total current liabilities.
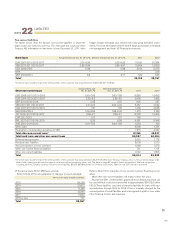
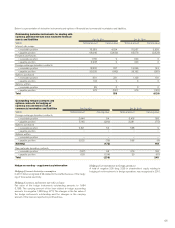
Balance sheet amounts for other current liabilities were as follows:
2011 2010
Advances from customers 3,642 3,416
Wages, salaries and withholding taxes 8,041 8,824
VAT liabilities 2,099 2,023
Accrued expenses and prepaid income 12,528 12,626
Deferred leasing income 1,683 1,640
Residual value liability 1,783 2,154
Other financial liabilities 367 242
Other liabilities 5,120 4,416
Total 35,263 35,341
Current liabilities also include trade payables of 56,788 (47,250), current
tax liabilities of 2,391 (1,732) and non interest-bearing and interest-bearing
liabilities held for sale, as recognized in Note 3. Secured bank loans at
year-end 2011 totalled 127 (216). The corresponding amount for other
current liabilities was 584 (1,442). Of current liabilities including trade
payables 102,331 (87,494) pertains to financial instruments. Refer to
note 30 Financial instruments.
Refer to Note 23 for an explanation of changes to assets pledged.
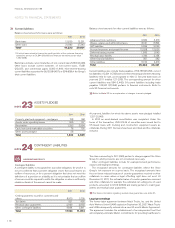
ASSETS PLEDGED
23
NOTE
2011 2010
Property, plant and equipment – mortgages 128 168
Assets under operating leases 265 107
Receivables 1,333 2,964
Cash, loans andmarketable securities 78 100
Other assets pledged 28 –
Total 1,832 3,339
At year-end, liabilities for which the above assets were pledged totalled
1,227 (2,946).
In 2010 an asset-backed securitization was completed. Under the
terms of the transaction, USD 616 M of securities were issued tied to
US-based loans with trucking and construction equipment assets as
collaterals. During 2011 the loans have been amortized and the collaterals
reduced.
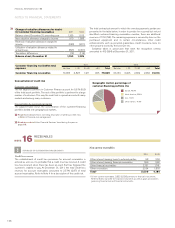
CONTINGENT LIABILITIES
24
NOTE
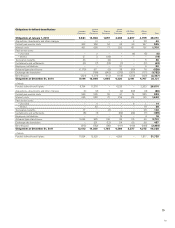
Contingent liabilities
A contingent liability is recognized for a possible obligation, for which it is
not yet confirmed that a present obligation exists that could lead to an
outflow of resources; or for a present obligation that does not meet the
definitions of a provision or a liability as it is not probable that an outflow
of resources will be required to settle the obligation or when a sufficiently
reliable estimate of the amount cannot be made.
2011 2010
Credit guarantees issued for customers and
others 8,970 3,709
Tax claims 521 490
Residual value guarantees 2,969 2,993
Other contingent liabilities 4,694 3,811
Total 17,154 11,003
Tax claims amounting to 521 (490) pertain to charges against the Volvo
Group for which provisions are not considered necessary.
Other contingent liabilities include for example bid and performance
clauses and legal proceedings.
The recognized amounts for contingent liabilities reflect the Volvo
Group’s risk exposure on a gross basis. The recognized amounts have
thus not been reduced because of counter guarantees received or other
collaterals in cases where a legal offsetting right does not exist. At
December 31, 2011, the estimated value of counter guarantees received
and other collaterals, for example the estimated net selling price of used
products, amounted to 3,726 (3,893) and mainly pertains to credit guar-
antees and residual value guarantees.
For more information regarding residual value guarantees, see note 21.
Legal proceedings
The former labor agreement between Mack Trucks, Inc. and the United
Auto Workers Union (UAW) expired on September 30, 2007. Mack Trucks
and UAW subsequently entered into a new 40-month Master Agreement.
The agreement includes the establishment of an independent trust that
will completely eliminate Mack’s commitments for providing healthcare to
ACCOUNTING POLICY
NOTES TO FINANCIAL STATEMENTS
FINANCIAL INFORMATION 2011
116