Volvo 2011 Annual Report Download - page 105
Download and view the complete annual report
Please find page 105 of the 2011 Volvo annual report below. You can navigate through the pages in the report by either clicking on the pages listed below, or by using the keyword search tool below to find specific information within the annual report.-
 1
1 -
2
-
3
-
4
-
5
-
6
-
7
-
8
-
9
-
10
-
11
-
12
-
13
-
14
-
15
-
16
-
17
-
18
-
19
-
20
-
21
-
22
-
23
-
24
-
25
-
26
-
27
-
28
-
29
-
30
-
31
-
32
-
33
-
34
-
35
-
36
-
37
-
38
-
39
-
40
-
41
-
42
-
43
-
44
-
45
-
46
-
47
-
48
-
49
-
50
-
51
-
52
-
53
-
54
-
55
-
56
-
57
-
58
-
59
-
60
-
61
-
62
-
63
-
64
-
65
-
66
-
67
-
68
-
69
-
70
-
71
-
72
-
73
-
74
-
75
-
76
-
77
-
78
-
79
-
80
-
81
-
82
-
83
-
84
-
85
-
86
-
87
-
88
-
89
-
90
-
91
-
92
-
93
-
94
-
 95
95 -
 96
96 -
 97
97 -
 98
98 -
 99
99 -
 100
100 -
 101
101 -
 102
102 -
 103
103 -
 104
104 -
 105
105 -
 106
106 -
 107
107 -
 108
108 -
 109
109 -
 110
110 -
 111
111 -
 112
112 -
 113
113 -
 114
114 -
 115
115 -
116
-
117
-
118
-
119
-
120
-
121
-
122
-
123
-
124
-
125
-
126
-
127
-
128
-
129
-
130
-
131
-
132
-
133
-
134
-
135
-
136
-
137
-
138
-
139
-
140
-
141
-
142
-
143
-
144
-
145
-
146
-
147
-
148
-
149
-
150
-
151
-
152
-
153
-
154
-
155
-
156
-
157
-
158
-
159
-
160
-
161
-
162
-
163
-
164
-
165
-
166
 |
 |

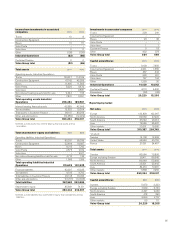
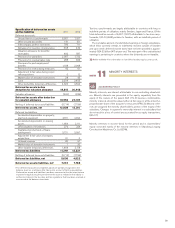
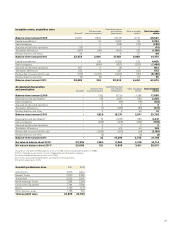
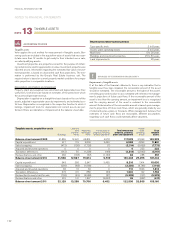
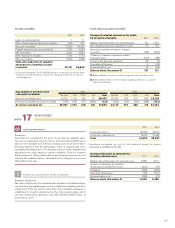
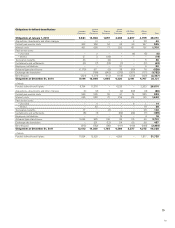
Intangible assets, acquisition costs Entrance fees,
industrial programs
Capitalized product
and software
development Other intangible
assets2Total intangible
assets Goodwill1
Balance-sheet amount 2009 23,827 3,833 25,148 6,719 59,527
Capital expenditures3– 15 3,255 54 3,324
Sales/scrapping – 0 (156) (79) (235)
Acquired and divested operations (70) 0 0 0 (70)
Translation differences (847) (49) (400) 138 (1,158)
Reclassifications and others 26 1 4 57 88
Balance-sheet amount 2010 22,936 3,800 27,851 6,889 61,476
Capital expenditures3– 109 4,238 122 4,469
Sales/scrapping – (484) (657) (323) (1,464)
Acquired and divested operations 967 0 (4) 0 963
Translation differences 272 1 431 (32) 672
Reclassified to assets held for sale (274) (3,199) (1,963) (60) (5,496)
Reclassifications and other (2) (3) 6 54 55
Balance-sheet amount 2011 23,899 224 29,902 6,650 60,675
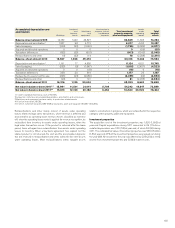
Accumulated depreciation
and amortization Entrance fees,
industrial programs
Capitalized product
and software
development Other intangible
assets2Total intangible
assets Goodwill1
Balance-sheet amount 2009 – 1,762 13,739 2,398 17,899
Depreciation and amortization5– 59 2,857 389 3,305
Sales/scrapping – 0 (45) (78) (123)
Acquired and divested operations – 0 0 0 0
Translation differences – (1) (285) (84) (370)
Reclassifications and other – 0 5 46 51
Balance-sheet amount 2010 – 1,820 16,271 2,671 20,762
Depreciation and amortization5– 76 2,788 383 3,247
Sales/scrapping – (265) (406) (322) (993)
Acquired and divested operations – 0 0 0 0
Translation differences – 0 312 33 345
Reclassified to assets held for sale (1,596) (570) (24) (2,190)
Reclassifications and other – (2) 1 (2) (3)
Balance-sheet amount 2011 – 33 18,396 2,739 21,168
Net value in balance sheet 2010422,936 1,980 11,580 4,218 40,714
Net value in balance sheet 2011423,899 191 11,506 3,911 39,507
1 Includes on the date of IFRS adoption, costs of 14,184 and accumulated amortization of 3,863.
2 Other intangible assets mainly consist of trademarks and distribution networks.
3 Includes capitalized borrowing costs of 112 (25).
4 Costs less accumulated depreciation, amortization and impairments.
5 Of which impairments 74 (7).
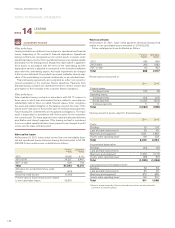
Goodwill per Business Area 2011 2010
Volvo Trucks 3,975 3,913
Renault Trucks 2,230 2,249
TrucksAsia 6,269 6,041
North AmericanTrucks 1,354 1,334
Construction Equipment 7,764 7,806
Buses 1,169 1,174
Other business areas 1,138 419
Total goodwill value 23,899 22,936
101