Volvo 2011 Annual Report Download - page 133
Download and view the complete annual report
Please find page 133 of the 2011 Volvo annual report below. You can navigate through the pages in the report by either clicking on the pages listed below, or by using the keyword search tool below to find specific information within the annual report.-
 1
1 -
2
-
3
-
4
-
5
-
6
-
7
-
8
-
9
-
10
-
11
-
12
-
13
-
14
-
15
-
16
-
17
-
18
-
19
-
20
-
21
-
22
-
23
-
24
-
25
-
26
-
27
-
28
-
29
-
30
-
31
-
32
-
33
-
34
-
35
-
36
-
37
-
38
-
39
-
40
-
41
-
42
-
43
-
44
-
45
-
46
-
47
-
48
-
49
-
50
-
51
-
52
-
53
-
54
-
55
-
56
-
57
-
58
-
59
-
60
-
61
-
62
-
63
-
64
-
65
-
66
-
67
-
68
-
69
-
70
-
71
-
72
-
73
-
74
-
75
-
76
-
77
-
78
-
79
-
80
-
81
-
82
-
83
-
84
-
85
-
86
-
87
-
88
-
89
-
90
-
91
-
92
-
93
-
94
-
95
-
96
-
97
-
98
-
99
-
100
-
101
-
102
-
103
-
104
-
105
-
106
-
107
-
108
-
109
-
110
-
111
-
112
-
113
-
114
-
115
-
116
-
117
-
118
-
119
-
120
-
121
-
122
-
 123
123 -
 124
124 -
 125
125 -
 126
126 -
 127
127 -
 128
128 -
 129
129 -
 130
130 -
 131
131 -
 132
132 -
 133
133 -
 134
134 -
 135
135 -
 136
136 -
 137
137 -
 138
138 -
 139
139 -
 140
140 -
 141
141 -
 142
142 -
 143
143 -
144
-
145
-
146
-
147
-
148
-
149
-
150
-
151
-
152
-
153
-
154
-
155
-
156
-
157
-
158
-
159
-
160
-
161
-
162
-
163
-
164
-
165
-
166
 |
 |
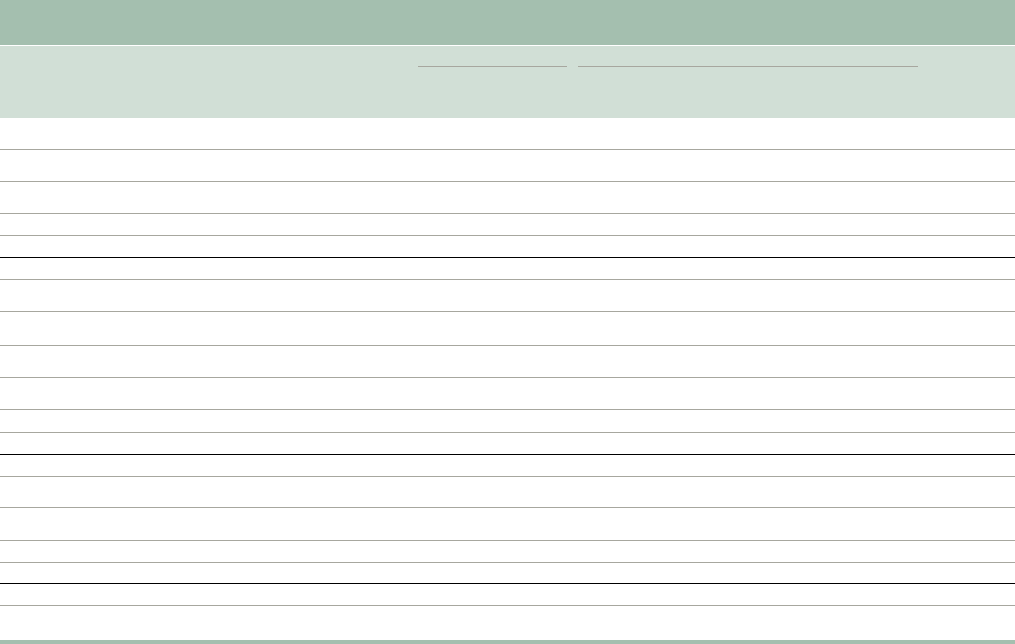
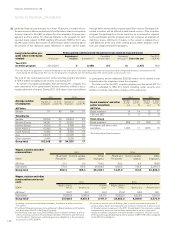
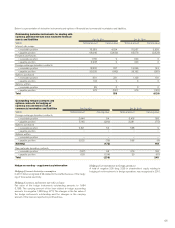
CHANGES IN SHAREHOLDERS’ EQUITY
Restricted equity Unrestricted equity
SEK M Share
capital Statutory
reserve
Share
premium
reserve Fair value
reserve Retained
earnings Total
Total
shareholders’
equity
Balance at December 31, 2009 2,554 7,337 190 21 21,251 21,462 31,353
Income for the period – – – – 10,328 10,328 10,328
Other comprehensive income
Available-for-sale investments:
Gain/(loss) at valuation to fair value – – – 172 – 172 172
Other comprehensive income – – – 172 – 172 172
Total income for the period – – – 172 10,328 10,500 10,500
Balance at December 31, 2010 2,554 7,337 190 193 31,579 31,962 41,853
Income for the period – – – – 5,481 5,481 5,481
Other comprehensive income
Available-for-sale investments:
Gain/(loss) at valuation to fair value – – – (159) – (159) (159)
Other comprehensive income – – – (159) – (159) (159)
Total income for the period – – – (159) 5,481 5,322 5,322
Transactions with shareholders
Cash dividend – – – – (5,069) (5,069) (5,069)
Dividend to AB Volvo’s shareholders – – 0 – 53 53 53
Transactions with shareholders – – 0 – (5,016) (5,016) (5,016)
Balance at December 31, 2011 2,554 7,337 190 34 32,044 32,268 42,159
Further information regarding the share capital of the Parent Company is shown in Note 19 to the consolidated financial statements.
129