Volvo 2011 Annual Report Download - page 76
Download and view the complete annual report
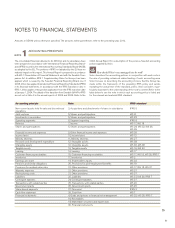
Please find page 76 of the 2011 Volvo annual report below. You can navigate through the pages in the report by either clicking on the pages listed below, or by using the keyword search tool below to find specific information within the annual report.-
 1
1 -
2
-
3
-
4
-
5
-
6
-
7
-
8
-
9
-
10
-
11
-
12
-
13
-
14
-
15
-
16
-
17
-
18
-
19
-
20
-
21
-
22
-
23
-
24
-
25
-
26
-
27
-
28
-
29
-
30
-
31
-
32
-
33
-
34
-
35
-
36
-
37
-
38
-
39
-
40
-
41
-
42
-
43
-
44
-
45
-
46
-
47
-
48
-
49
-
50
-
51
-
52
-
53
-
54
-
55
-
56
-
57
-
58
-
59
-
60
-
61
-
62
-
63
-
64
-
65
-
 66
66 -
 67
67 -
 68
68 -
 69
69 -
 70
70 -
 71
71 -
 72
72 -
 73
73 -
 74
74 -
 75
75 -
 76
76 -
 77
77 -
 78
78 -
 79
79 -
 80
80 -
 81
81 -
 82
82 -
 83
83 -
 84
84 -
 85
85 -
 86
86 -
87
-
88
-
89
-
90
-
91
-
92
-
93
-
94
-
95
-
96
-
97
-
98
-
99
-
100
-
101
-
102
-
103
-
104
-
105
-
106
-
107
-
108
-
109
-
110
-
111
-
112
-
113
-
114
-
115
-
116
-
117
-
118
-
119
-
120
-
121
-
122
-
123
-
124
-
125
-
126
-
127
-
128
-
129
-
130
-
131
-
132
-
133
-
134
-
135
-
136
-
137
-
138
-
139
-
140
-
141
-
142
-
143
-
144
-
145
-
146
-
147
-
148
-
149
-
150
-
151
-
152
-
153
-
154
-
155
-
156
-
157
-
158
-
159
-
160
-
161
-
162
-
163
-
164
-
165
-
166
 |
 |

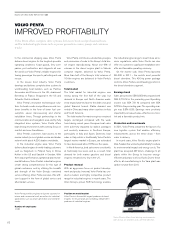
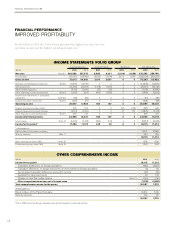
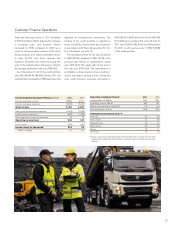
For the full year 2011, the Volvo Group generated the highest net sales, the best
operating income and the highest operating margin ever.1
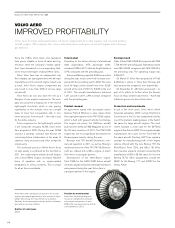
FINANCIAL PERFORMANCE
IMPROVED PROFITABILITY
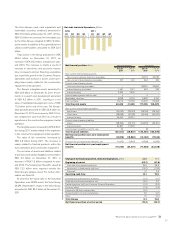
INCOME STATEMENTS VOLVO GROUP
Industrial operations Customer Finance Eliminations Volvo Group Total
SEK M 2011 2010 2011 2010 2011 2010 2011 2010
Net sales Note 6,7 303,589 257,375 8,883 9,031 (2,104) (1,658) 310,367 264,749
Cost of sales (231,516) (197,480) (5,693) (5,974) 2,104 1,658 (235,104) (201,797)
Gross income 72,073 59,895 3,190 3,057 0 0 75,263 62,952
Research and development expenses Note 6 (13,276) (12,970) 0 0 0 0 (13,276) (12,970)
Selling expenses (24,383) (22,649) (1,618) (1,500) 0 0 (26,001) (24,149)
Administrative expenses (7,105) (5,640) (27) (25) 0 0 (7,132) (5,666)
Other operating income and expenses Note 8 (1,045) (659) (603) (1,365) 0 0 (1,649) (2,023)
Income from investments in associated
companies Note 5,6 (82) (86) 0 0 0 0 (81) (86)
Income from other investments Note 5 (225) (57) 0 0 0 0 (225) (58)
Operating income 25,957 17,834 942 167 0 0 26,899 18,000
Interest income and similar credits 644 544 0 0 (37) (102) 608 442
Interest expenses and similar charges (2,912) (3,244) 0 0 37 102 (2,875) (3,142)
Other financial income and expenses Note 9 297 213 0 0 0 0 297 213
Income after financial items 23,986 15,347 942 167 0 0 24,929 15,514
Income taxes Note 10 (6,490) (4,168) (323) (134) 0 0 (6,814) (4,302)
Income for the period* 17,496 11,179 619 32 0 0 18,115 11,212
* Attributable to:
Equity holders of the parent company 17,751 10,866
Minority interests Note 11 364 346
18,115 11,212
Basic earnings per share, SEK Note 19 8.76 5.36
Diluted earnings per share, SEK Note 19 8.75 5.36
OTHER COMPREHENSIVE INCOME
SEK M 2011 2010
Income for the period 18,115 11,212
Translation differences on foreign operations (980) (3,891)
Translation differences on hedge instruments of net investment in foreign operations (3) 113
Accumulated translation difference reversed to income (30) (95)
Available-for-sale investments 39 148
Change in cash flow hedge reserve Note 19 (144) (156)
Other comprehensive income, net of income taxes (1,118) (3,881)
Total comprehensive income for the period 16,997 7,331
Attributable to:
Equity holders of the Parent Company 16,551 7,016
Minority interests 446 315
16,997 7,331
1 Since 1999, when the Group’s operation was directed towards commercial vehicles.
72
FINANCIAL INFORMATION 2011