Volvo 2011 Annual Report Download - page 92
Download and view the complete annual report
Please find page 92 of the 2011 Volvo annual report below. You can navigate through the pages in the report by either clicking on the pages listed below, or by using the keyword search tool below to find specific information within the annual report.-
 1
1 -
2
-
3
-
4
-
5
-
6
-
7
-
8
-
9
-
10
-
11
-
12
-
13
-
14
-
15
-
16
-
17
-
18
-
19
-
20
-
21
-
22
-
23
-
24
-
25
-
26
-
27
-
28
-
29
-
30
-
31
-
32
-
33
-
34
-
35
-
36
-
37
-
38
-
39
-
40
-
41
-
42
-
43
-
44
-
45
-
46
-
47
-
48
-
49
-
50
-
51
-
52
-
53
-
54
-
55
-
56
-
57
-
58
-
59
-
60
-
61
-
62
-
63
-
64
-
65
-
66
-
67
-
68
-
69
-
70
-
71
-
72
-
73
-
74
-
75
-
76
-
77
-
78
-
79
-
80
-
81
-
 82
82 -
 83
83 -
 84
84 -
 85
85 -
 86
86 -
 87
87 -
 88
88 -
 89
89 -
 90
90 -
 91
91 -
 92
92 -
 93
93 -
 94
94 -
 95
95 -
 96
96 -
 97
97 -
 98
98 -
 99
99 -
 100
100 -
 101
101 -
 102
102 -
103
-
104
-
105
-
106
-
107
-
108
-
109
-
110
-
111
-
112
-
113
-
114
-
115
-
116
-
117
-
118
-
119
-
120
-
121
-
122
-
123
-
124
-
125
-
126
-
127
-
128
-
129
-
130
-
131
-
132
-
133
-
134
-
135
-
136
-
137
-
138
-
139
-
140
-
141
-
142
-
143
-
144
-
145
-
146
-
147
-
148
-
149
-
150
-
151
-
152
-
153
-
154
-
155
-
156
-
157
-
158
-
159
-
160
-
161
-
162
-
163
-
164
-
165
-
166
 |
 |

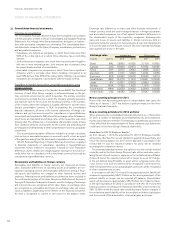
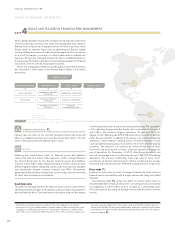
The table on the preceding page F shows outstanding forward and option
contracts for the hedging of commercial currency risks. The table on page
74 shows commercial net flows per currency (transactional flows net).
Translation exposure during the consolidation of operating income
in foreign subsidiaries
In conjunction with the translation of operating income in foreign subsidi-
aries, Volvo’s earnings are impacted if currency rates change. Volvo does
not hedge this risk. For more information on currency hedging of equity
see below.
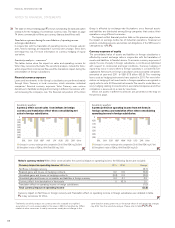
Sensitivity analysis – currencies*
The tables below show the impact on sales and operating income for
Volvo if key currencies fluctuate. The sensitivity analysis include the trans-
action impact from commercial flows and the translation impact during the
consolidation of foreign subsidiaries.
Financial currency exposure
Loans and investments in the Group’s subsidiaries are performed mainly
through Volvo Treasury in local currencies, which minimizes individual
companies’ financial currency exposure. Volvo Treasury uses various
derivatives to facilitate lending and borrowing in different currencies with-
out increasing the company’s risk. The financial net position of the Volvo
Group is affected by exchange-rate fluctuations since financial assets
and liabilities are distributed among Group companies that conduct their
operations using different currencies.
The Impact on Net financial position table on the previous page shows
the impact on earnings before tax of Industrial operations financial net
position, including pensions and similar net obligations, if the SEK were to
strengthen by 10%. D
Currency exposure of equity
The consolidated value of assets and liabilities in foreign subsidiaries is
affected by current exchange rates in conjunction with the translation of
assets and liabilities to Swedish kronor. To minimize currency exposure of
equity, the size of equity in foreign subsidiaries is continuously optimized
with respect to commercial and legal conditions. Currency hedging of
equity may occur in cases where a foreign subsidiary is considered over-
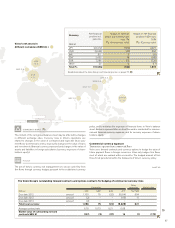
capitalized. Net assets in foreign subsidiaries and associated companies
amounted at year-end 2011 to SEK 67.8 billion (60.3). The remaining
loans used as hedging instruments have expired in 2011. For more infor-
mation on hedging of net investments in foregin operations recognized in
equity refer to note 30 Financial Instruments.The need to undertake cur-
rency hedging relating to investments in associated companies and other
companies is assessed on a case-by-case basis.
Volvos net assets in different currencies are presented on the map on
the previous page.
0
Changes in currency exchange rates compared to 2010 (Total SEK neg 20,2 bn)
Strengthen in value of SEK by 10% (Total SEK neg 31,0)
(1.0)
(2.0)
(3.0)
(4.0)
(5.0)
(6.0)
(7.0)
(8.0)
CNYBRL EUR GBP JPY RUB USD ZAR OtherINR
G
Sensitivity analysis
Currency effect on net sales from inflows in foreign
currency and translation effect when consolidating net
sales in foreign subsidiaries.
0
Changes in currency exchange rates compared to 2010 (Total SEK neg 4,7 bn)
Strengthen in value of SEK by 10% (Total SEK neg 6,3)
(0.5)
(1.0)
(1.5)
(2.0)
(2.5)
(3.0)
CNYBRL EUR GBP KRW RUB USD ZAR Other
H
Sensitivity analysis
Currency effect on operating income from net flows in
foreign currency and translation effect when consolidating
operating income in foreign subsidiaries.
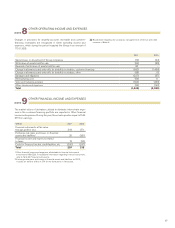
Currency impact on operating income SEK billion 2011 2010 Change
Net flows in foreign currency (3.7)
Realizedgains and losses onhedging contracts 0.2 0.5 (0.3)
Unrealizedgains and lossesonhedging contracts (0.3) 0.2 (0.5)
Unrealizedgains and lossesonreceivables andliabilities in foreign currency 0.3 0.1 0.2
Currency effect from devaluation in Venezuela 0 (0.1) 0.1
Translation effect on operating income in foreign subsidiaries (1.0)
Total currency impact on operating income (5.2)
Currency impact onNet flows in foreign currency and Translationeffect on operating income in foreign subsidiaries are detailed in table
Hin key currencies for Volvo.
Volvo’s currency review When Volvo communicates the currency impact on operating income, the following factors are included:
I
* The Note’s sensitivity analysis on currency rate risks is based on simplified
assumptions. It is not unreasonable for the value in SEK to strengthen by 10% in
relation to other currencies. In reality, currencies usually do not change in the
same direction at any given time, so the actual effect of exchange-rate changes
may differ from the sensitivity analysis. Please refer to table D G H
NOTES TO FINANCIAL STATEMENTS
FINANCIAL INFORMATION 2011
88