Volvo 2011 Annual Report Download - page 114
Download and view the complete annual report
Please find page 114 of the 2011 Volvo annual report below. You can navigate through the pages in the report by either clicking on the pages listed below, or by using the keyword search tool below to find specific information within the annual report.-
 1
1 -
2
-
3
-
4
-
5
-
6
-
7
-
8
-
9
-
10
-
11
-
12
-
13
-
14
-
15
-
16
-
17
-
18
-
19
-
20
-
21
-
22
-
23
-
24
-
25
-
26
-
27
-
28
-
29
-
30
-
31
-
32
-
33
-
34
-
35
-
36
-
37
-
38
-
39
-
40
-
41
-
42
-
43
-
44
-
45
-
46
-
47
-
48
-
49
-
50
-
51
-
52
-
53
-
54
-
55
-
56
-
57
-
58
-
59
-
60
-
61
-
62
-
63
-
64
-
65
-
66
-
67
-
68
-
69
-
70
-
71
-
72
-
73
-
74
-
75
-
76
-
77
-
78
-
79
-
80
-
81
-
82
-
83
-
84
-
85
-
86
-
87
-
88
-
89
-
90
-
91
-
92
-
93
-
94
-
95
-
96
-
97
-
98
-
99
-
100
-
101
-
102
-
103
-
 104
104 -
 105
105 -
 106
106 -
 107
107 -
 108
108 -
 109
109 -
 110
110 -
 111
111 -
 112
112 -
 113
113 -
 114
114 -
 115
115 -
 116
116 -
 117
117 -
 118
118 -
 119
119 -
 120
120 -
 121
121 -
 122
122 -
 123
123 -
 124
124 -
125
-
126
-
127
-
128
-
129
-
130
-
131
-
132
-
133
-
134
-
135
-
136
-
137
-
138
-
139
-
140
-
141
-
142
-
143
-
144
-
145
-
146
-
147
-
148
-
149
-
150
-
151
-
152
-
153
-
154
-
155
-
156
-
157
-
158
-
159
-
160
-
161
-
162
-
163
-
164
-
165
-
166
 |
 |

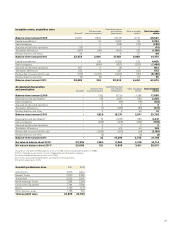
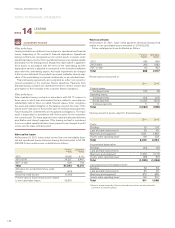
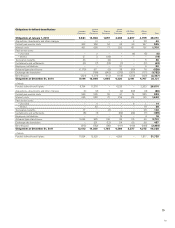
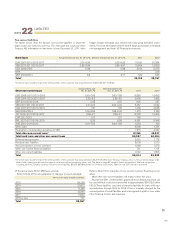
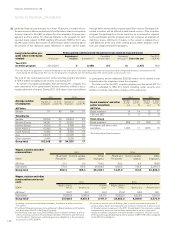
Summary of provision for
post-employment benefits 2011 2010
Obligations 40,358 36,121
Fair value of plan assets 23,873 22,954
Funded status (16,485) (13,167)
Unrecognized actuarial (gains) and losses 11,939 6,995
Unrecognized past service costs 222 310
Net provisions for post-employment
benefits (4,324) (5,862)
Whereof related to Assets held for sale 64 –
Net provision for post-employment
benefits excluding Assets held for sale (4,388) (5,862)
Assumptions applied for actuarial
calculations, % December 31
2011 December 31
2010
Sweden
Discount rate13.50 4.75
Expected return on plan assets26.00 6.00
Expected salary increase 3.00 3.00
Inflation 1.50 1.50
United States
Discount rate1 3 3.00–4.75 3.25–5.50
Expected return on plan assets27.65 7.65
Expected salary increase 3.00 3.00
Inflation 2.00 2.00
France
Discount rate14.50 4.50
Expected salary increase 3.00 1.00–3.00
Inflation 1.50 1.50
Great Britain
Discount rate14.75–5.00 5.40–5.50
Expected return on plan assets23.60–4.50 5.00
Expected salary increases 3.30–3.40 3.70–3.85
Inflation 3.20 3.20
1 The discount rate for each country is determined by reference to market yields
on high-quality corporate bonds. In countries where there is no functioning market
in such bonds, the market yields on government bonds are used. The discount
rate for the Swedish pension obligation 2011 is determined by reference to
mortgage bonds.
2 Applicable in the subsequent accounting period. These assumptions reflect the
expected long-term return rate on plan assets, based upon historical yield rates
for different categories of investments and weighted in accordance with the
foundation’s investment policy. The expected return has been calculated net of
administrative expenses and applicable taxes.
3 For all plans except one the discount rate used is within the range 4.25–4.75%
(4.75–5.50).
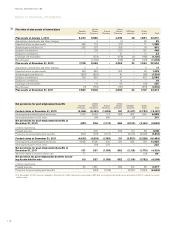
Pension costs 2011 2010
Current year service costs 867 896
Interest costs 1,448 1,510
Expected return on plan assets (1,405) (1,402)
Actuarial gains and losses1326 420
Past service costs
– Unvested 9 19
– Vested 60 28
Curtailments and settlements 50 (38)
Termination benefits 84 34
Pension costs for the period, defined-
benefit plans 1,439 1,467
Pension costs for defined-contribution plans22,032 2,107
Total pension costs for the period 3,471 3,574
1 For each plan, actuarial gains and losses are recognized as income or expense
when the accumulated amount exceeds the so-called corridor. The income or
expenses are then recognized over the expected average remaining service
period of the employees.
2 In certain countries, part of social cost relate to pensions. In previous years,
Volvo has reclassified such portion of social cost to pension cost for Swedish
group companies. In the 2011 Annual Report, these pension related components
of social cost has not been reclassified to pension cost, which makes for a better
comparison with other Swedish companies. Pension cost for 2010 has been
adjusted downwards with an amount of 1,166 compared to the 2010 Annual
Report.
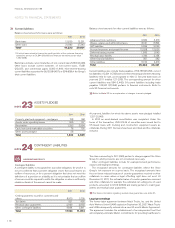
Costs for the period, post-employment
benefits other than pensions 2011 2010
Current year service costs 85 49
Interest costs 148 170
Expected return on plan assets – –
Actuarial gains and losses19 (1)
Past service costs
– Unvested 5 –
– Vested – 26
Curtailments and settlements (35) 2
Termination benefits 25 7
Total costs for the period, post-employ-
ment benefits other than pensions 237 253
1 For each plan, actuarial gains and losses are reported as income or expense when
the accumulated amount exceed the so called corridor. The income or expenses
are then recognized over the expected average remaining service period of the
employees.
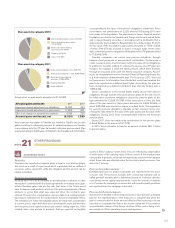
An increase of one percentage point per year in healthcare costs would
increase the accumulated post-employment benefit obligation as of
December 31, 2011 by approximately 164, and the post-employment benefit
expense for the period by approximately 8. A decrease of one percentage
point would decrease the accumulated value of obligations by about 136
and reduce costs for the period by approximately 7. Calculations made as
of December 31, 2011 show an annual increase of 8% in the weighted
average per capita costs of covered health care benefits. It is assumed
that the percentage will decline gradually to 4.5% until 2029 and subse-
quently remain at that level.
NOTES TO FINANCIAL STATEMENTS
FINANCIAL INFORMATION 2011
110