Volvo 2011 Annual Report Download - page 111
Download and view the complete annual report
Please find page 111 of the 2011 Volvo annual report below. You can navigate through the pages in the report by either clicking on the pages listed below, or by using the keyword search tool below to find specific information within the annual report.-
 1
1 -
2
-
3
-
4
-
5
-
6
-
7
-
8
-
9
-
10
-
11
-
12
-
13
-
14
-
15
-
16
-
17
-
18
-
19
-
20
-
21
-
22
-
23
-
24
-
25
-
26
-
27
-
28
-
29
-
30
-
31
-
32
-
33
-
34
-
35
-
36
-
37
-
38
-
39
-
40
-
41
-
42
-
43
-
44
-
45
-
46
-
47
-
48
-
49
-
50
-
51
-
52
-
53
-
54
-
55
-
56
-
57
-
58
-
59
-
60
-
61
-
62
-
63
-
64
-
65
-
66
-
67
-
68
-
69
-
70
-
71
-
72
-
73
-
74
-
75
-
76
-
77
-
78
-
79
-
80
-
81
-
82
-
83
-
84
-
85
-
86
-
87
-
88
-
89
-
90
-
91
-
92
-
93
-
94
-
95
-
96
-
97
-
98
-
99
-
100
-
 101
101 -
 102
102 -
 103
103 -
 104
104 -
 105
105 -
 106
106 -
 107
107 -
 108
108 -
 109
109 -
 110
110 -
 111
111 -
 112
112 -
 113
113 -
 114
114 -
 115
115 -
 116
116 -
 117
117 -
 118
118 -
 119
119 -
 120
120 -
 121
121 -
122
-
123
-
124
-
125
-
126
-
127
-
128
-
129
-
130
-
131
-
132
-
133
-
134
-
135
-
136
-
137
-
138
-
139
-
140
-
141
-
142
-
143
-
144
-
145
-
146
-
147
-
148
-
149
-
150
-
151
-
152
-
153
-
154
-
155
-
156
-
157
-
158
-
159
-
160
-
161
-
162
-
163
-
164
-
165
-
166
 |
 |
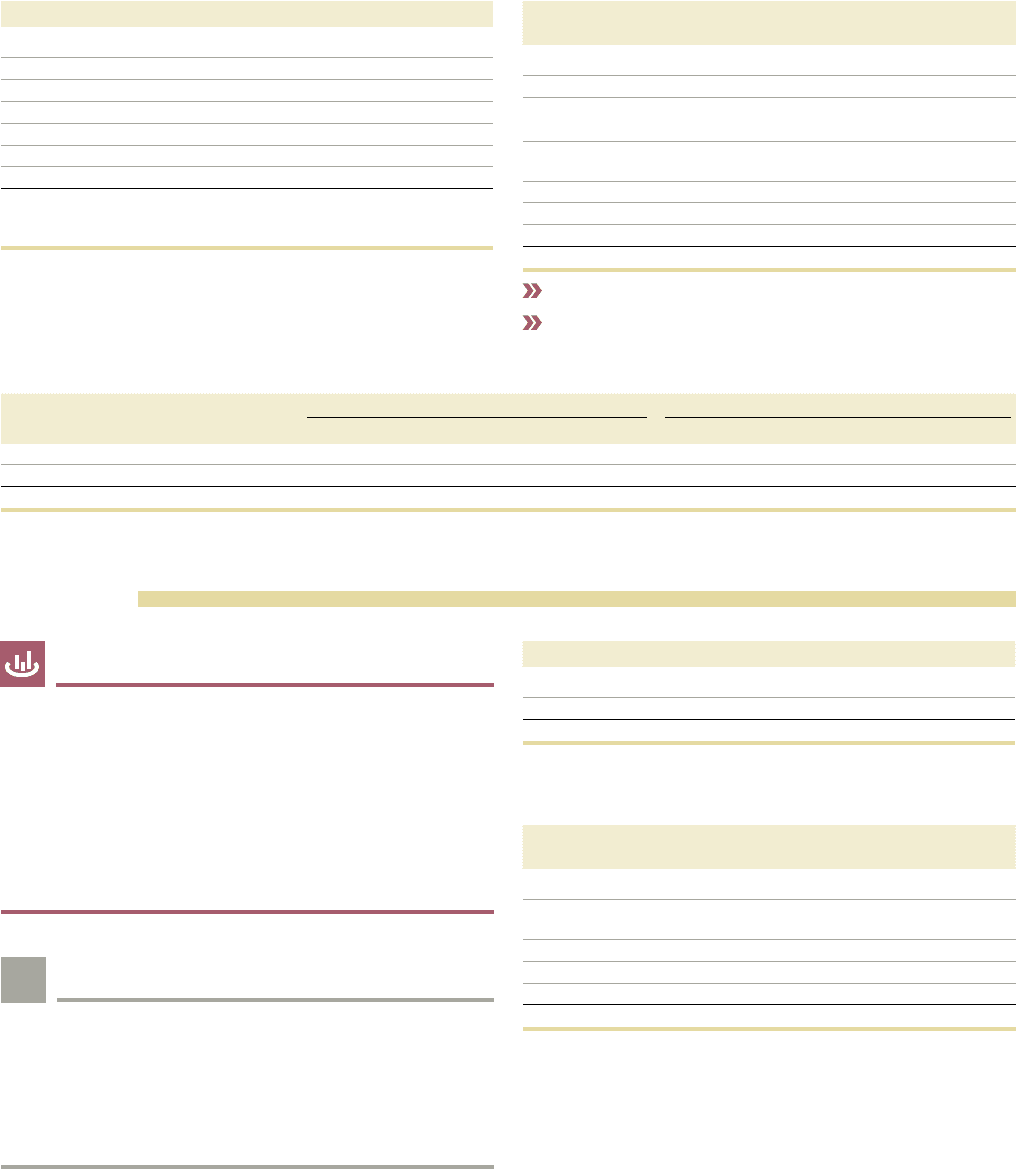
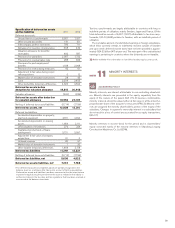
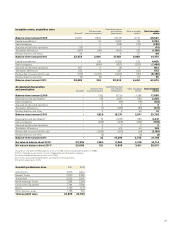
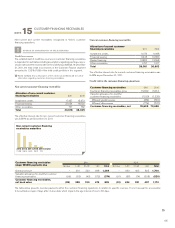
Current receivables
2011 2010
Loans to external parties 1 11
Other interest-bearing financial receivables 666 331
Accounts receivable 27,699 24,433
Prepaid expenses and accrued income 2,761 3,043
VAT receivables 3,387 2,662
Other financial receivables 1,746 1,715
Other receivables 5,932 4,436
Total, after deduction of valuation
allowances for doubtful accounts
receivable142,191 36,633
1 Of current receivables, 30,133 (26,490) pertains to financial instruments. Refer
to Notes 4 and 30 for financial instruments and goals and policies in financial
risk management.
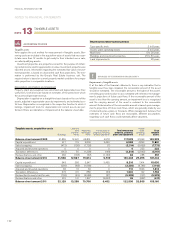
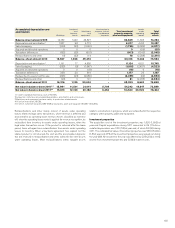
Credit risks in accounts receivable
Change of valuation allowances for doubt-
ful accounts receivable 2011 2010
Balance sheet, December 31, preceding year 721 1,301
New valuation allowance charged to income 175 187
Reversal of valuation allowance charged
to income (126) (609)
Utilization of valuation allowance related
to actual losses (100) (86)
Acquired and divested operations 33 (1)
Translation differences 5 (44)
Reclassifications, etc. 24 (28)
Balance sheet, December 31 731 721
Refer to Note 4 for more information regarding Volvo’s financial risks.
Refer to Note 15 for more information regarding credit risk in customer
financing receivables.
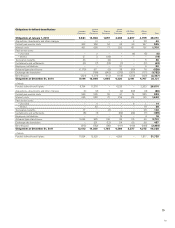
Age analysis of portfolio value
– Accounts receivable
2011 2010
Not Due 1-30 31-90 >90 Total Not Due 1-30 31-90 >90 Total
Accounts receivable gross 26,152 1,102 465 711 28,430 23,324 799 391 640 25,154
Provision for doubtful accounts receivable (155) (30) (57) (490) (731) (205) (26) (26) (464) (721)
Accounts receivable net 25,997 1,073 408 221 27,699 23,119 773 365 176 24,433
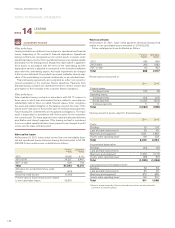
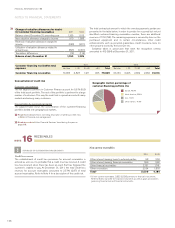
INVENTORIES
17
NOTE
Inventories
Inventories are recognized at the lower of cost and net realizable value.
The cost is established using the first-in, first-out method (FIFO) and is
based on the standard cost method, including costs for all direct manu-
facturing expenses and the attributable share of capacity and other
manufacturing-related costs. The standard costs are tested regularly and
adjustments are made based on current conditions. Costs for research
and development, selling, administration and financial expenses are not
included. Net realizable value is calculated as the selling price less costs
attributable to the sale.
2011 2010
Finished products 28,985 24,572
Production materials, etc. 15,614 15,265
Total 44,599 39,837
Inventories recognized as cost of sold products during the period
amounted to 219,946 (170,723).
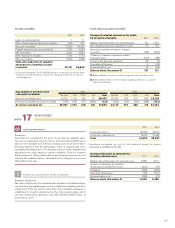
Increase (decrease) in allowance for
inventory obsolescence 2011 2010
Balance sheet, December 31, preceding year 3,382 4,101
Increase in allowance for inventory
obsolescence charged to income (213) (79)
Scrapping (264) (439)
Translation differences (23) (191)
Reclassifications, etc. (258) (10)
Balance sheet, December 31 2,624 3,382
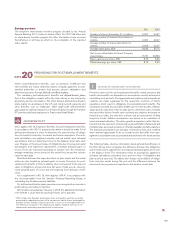
ACCOUNTING POLICY
Inventory obsolescence
Fair value is adjusted by the estimated value depletion of outdated articles,
over-stocking, physical damages, inventory lead-times, handling and other
selling costs. If the fair value is lower than cost, a valuation allowance is
established for inventory obsolescence. The total inventory value, net of
inventory obsolescence allowance, was SEK 44,599 (39,837) billion at
December 31, 2011.
SOURCE OF UNCERTAINTY IN THE ESTIMATES
!
107