Volvo 2011 Annual Report Download - page 82
Download and view the complete annual report
Please find page 82 of the 2011 Volvo annual report below. You can navigate through the pages in the report by either clicking on the pages listed below, or by using the keyword search tool below to find specific information within the annual report.
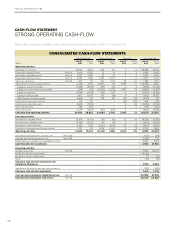
During 2011, operating cash flow in the Industrial Operations amounted to SEK 14.1 billion (19.0).
CASH-FLOW STATEMENT
STRONG OPERATING CASH-FLOW
CONSOLIDATED CASH-FLOW STATEMENTS
Industrial operations Customer Finance Eliminations Volvo Group Total
SEK M
Dec 31
2011
Dec 31
2010
Dec 31
2011
Dec 31
2010
Dec 31
2011
Dec 31
2010
Dec 31
2011
Dec 31
2010
Operating activities
Operating income (loss) 25,957 17,834 942 167 0 (1) 26,899 18,000
Depreciation tangible assets Note 13 6,109 6,060 15 15 0 2 6,124 6,077
Amortization intangible assets Note 12 3,227 3,282 20 23 0 0 3,247 3,305
Depreciation leasing vehicles Note 13 2,083 1,996 2,537 2,415 1 (1) 4,621 4,410
Other non-cash items Note 29 622 170 614 1,330 26 61 1,262 1,561
Total change in working capital whereof (4,180) 4,576 (13,831) 148 2,926 77 (15,085) 4,801
Change in accounts receivable (3,094) (4,049) (101) 316 0 0 (3,195) (3,733)
Change in customer financing receivables (240) (174) (14,202) (1,271) 3,007 98 (11,435) (1,347)
Change in inventories (7,099) (4,769) (155) 847 0 1 (7,254) (3,921)
Change in trade payables 9,871 13,057 107 (46) 0 0 9,978 13,011
Other changes in working capital (3,618) 511 520 302 (81) (22) (3,179) 791
Interest and similar items received 720 532 – – (42) (103) 678 429
Interest and similar items paid (3,391) (2,768) – – 12 36 (3,379) (2,732)
Other financial items (184) (604) – – 0 0 (184) (604)
Income taxes paid (4,129) (2,255) (384) (336) 0 1 (4,513) (2,590)
Cash flow from operating activities 26,834 28,823 (10,087) 3,762 2,923 72 19,670 32,657
Investing activities
Investments in tangible assets (8,267) (6,729) (50) (97) 27 67 (8,290) (6,759)
Investments in intangible assets (4,293) (3,557) (20) (18) 0 0 (4,313) (3,575)
Investment in leasing vehicles (1,422) (295) (6,044) (4,554) 53 38 (7,413) (4,811)
Disposals of fixed assets and leasing vehicles 1,233 776 2,099 2,293 0 (2) 3,332 3,067
Operating cash flow 14,085 19,018 (14,102) 1,386 3,003 175 2,986 20,579
Investments and divestments of shares, net Note 5,29 (119) (106)
Acquired and divested operations, net Note 3,29 (1,590) 617
Interest-bearing receivables incl marketable securities 2,665 6,813
Cash-flow after net investments 3,942 27,903
Financing activities
Change in loans, net Note 29 8,734 (25,711)
Dividend to AB Volvo shareholders (5,069) –
Dividend to minority shareholders (2) (75)
Other (30) (25)
Change in cash and cash equivalents excl.
translation differences 7,575 2,092
Translation difference on cash and cash equivalents (162) (360)
Change in cash and cash equivalents 7,413 1,732
Cash and cash equivalents, Beginning of year Note 18 22,966 21,234
Cash and cash equivalents, End of year Note 18 30,379 22,966
78
FINANCIAL INFORMATION 2011


