Volvo 2011 Annual Report Download - page 81
Download and view the complete annual report
Please find page 81 of the 2011 Volvo annual report below. You can navigate through the pages in the report by either clicking on the pages listed below, or by using the keyword search tool below to find specific information within the annual report.-
 1
1 -
2
-
3
-
4
-
5
-
6
-
7
-
8
-
9
-
10
-
11
-
12
-
13
-
14
-
15
-
16
-
17
-
18
-
19
-
20
-
21
-
22
-
23
-
24
-
25
-
26
-
27
-
28
-
29
-
30
-
31
-
32
-
33
-
34
-
35
-
36
-
37
-
38
-
39
-
40
-
41
-
42
-
43
-
44
-
45
-
46
-
47
-
48
-
49
-
50
-
51
-
52
-
53
-
54
-
55
-
56
-
57
-
58
-
59
-
60
-
61
-
62
-
63
-
64
-
65
-
66
-
67
-
68
-
69
-
70
-
 71
71 -
 72
72 -
 73
73 -
 74
74 -
 75
75 -
 76
76 -
 77
77 -
 78
78 -
 79
79 -
 80
80 -
 81
81 -
 82
82 -
 83
83 -
 84
84 -
 85
85 -
 86
86 -
 87
87 -
 88
88 -
 89
89 -
 90
90 -
 91
91 -
92
-
93
-
94
-
95
-
96
-
97
-
98
-
99
-
100
-
101
-
102
-
103
-
104
-
105
-
106
-
107
-
108
-
109
-
110
-
111
-
112
-
113
-
114
-
115
-
116
-
117
-
118
-
119
-
120
-
121
-
122
-
123
-
124
-
125
-
126
-
127
-
128
-
129
-
130
-
131
-
132
-
133
-
134
-
135
-
136
-
137
-
138
-
139
-
140
-
141
-
142
-
143
-
144
-
145
-
146
-
147
-
148
-
149
-
150
-
151
-
152
-
153
-
154
-
155
-
156
-
157
-
158
-
159
-
160
-
161
-
162
-
163
-
164
-
165
-
166
 |
 |

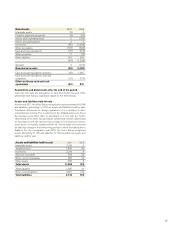
The Volvo Group’s cash, cash equivalents and
marketable securities combined, amounted to
SEK 37.2 billion at December 31, 2011. Of this,
SEK 9.3 billion are restricted for immediate use
by the Volvo Group compared to SEK 7.4 billion
a year earlier. In addition to this, granted but not
utilized credit facilities amounted to SEK 33.4
billion.
Total assets in the Group amounted to SEK
353.2 billion on December 31, 2011, an
increase of SEK 35.2 billion compared to year-
end 2010. The increase is mainly a result of
increase in inventories and accounts receiva-
bles, increased customer financing receivables
due to portfolio growth in the Customer Finance
Operations and increase in assets under oper-
ating lease mainly related to the construction
equipment rental operation.
The Group’s intangible assets amounted to
SEK 39.5 billion on December 31, 2011. Invest-
ments in research and development amounted
to SEK 4.2 billion in 2011, resulting in a net
value of capitalized development costs of SEK
11.5 billion at the end of the year. The Group’s
total goodwill amounted to SEK 23.9 billion on
December 31, 2011, an increase by SEK 1.0 bil-
lion compared to year-end 2010 as a result of
aquisitions in the construction equipment rental
operation.
The tangible assets increased by SEK 4.6 bil-
lion during 2011, mainly related to the expansion
in the construction equipment rental operation.
The value of the inventories increased by
SEK 4.8 billion during 2011. The increase is
mainly related to finished products within the
truck operations and construction equipment.
The net value of assets and liabilities related
to pensions and similar obligations amounted to
SEK 4.4 billion on December 31, 2011, a
decrease of SEK 1.5 billion compared to year-
end 2010. Post-employment benefits valued at
SEK 12.2 billion were reported outside the
Volvo Group’s balance sheet. For further infor-
mation see Note 20.
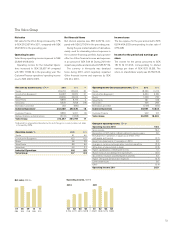
At year-end, the equity ratio in the Industrial
Operations was 28.5% and in the Volvo Group
24.3%. Shareholder’s equity in the Volvo Group
amounted to SEK 85.7 billion at December 31,
2011.
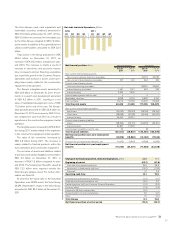
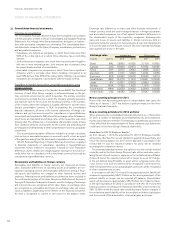
Net financial position, SEK M Industrial Operations Volvo Group
Dec 31
2011
Dec 31
2010
Dec 31
2011
Dec 31
2010
Non-currentinterest-bearing assets
Non-current customer-financing receivables – – 40,618 36,025
Non-current interest-bearing receivables 757 941 694 766
Currentinterest-bearing assets
Customer-financing receivables – – 38,081 36,663
Interest-bearing receivables 1,461 1,071 667 342
Internal funding 2,253 7,505 – –
Interest-bearing assets held for sale 4 – 4 –
Marketable securities 6,838 9,735 6,862 9,767
Cash and bank 29,113 21,756 30,379 22,966
Total financial assets 40,426 41,008 117,305 106,529
Non-currentinterest-bearing liabilities
Bond loans (38,192) (38,767) (38,192) (38,767)
Other loans (38,848) (37,180) (47,765) (45,327)
Internal funding 35,453 26,971 – –
Currentinterest-bearing liabilities
Loans (38,644) (32,101) (44,522) (39,601)
Internal funding 24,837 21,220 – –
Interest-bearing liabilities held for sale (6) – (6) –
Total financial liabilities (55,400) (59,857) (130,485) (123,695)
Net financial position excl. post employment
benefits (14,974) (18,849) (13,180) (17,166)
Provision for post employment benefits, net (4,372) (5,842) (4,388) (5,862)
Net financial position incl. post employment
benefits (19,346) (24,691) (17,568) (23,028)
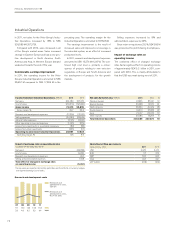
Change in net financial position, Industrial Operations, SEK bn 2011 2010
Beginning of period (24.7) (41.5)
Cash flow from operating activities 26.9 28.8
Investments in fixed assets (to)/from (14.0) (10.6)
Disposals 1.2 0.8
Operating cash-flow 14.1 19.0
Investments and divestments of shares (0.1) (0.1)
Acquired and divested operations, net (3.0) 0.2
Capital injections (to)/from Customer Finance Operations (0.1) (0.5)
Currency effect (1.9) (1.6)
Payment to AB Volvo shareholders (5.1) –
Dividend paid to minority shareholders 0.0 (0.1)
Other 1.5 (0.1)
Total change 5.4 16.8
Net financial position at end of period (19.3) (24.7)
Net debt, Industrial Operations, SEK bn
2010 2011
Q4
(19.3)
Q3
(29.6)
Q2
(28.3)
Q1
(27.3)
Q4
(24.7)
Q3
(38.4)
Q2
(39.9)
Q1
(45.0)
Read more about capital structure on page 6–7
77