Volvo 2011 Annual Report Download - page 153
Download and view the complete annual report
Please find page 153 of the 2011 Volvo annual report below. You can navigate through the pages in the report by either clicking on the pages listed below, or by using the keyword search tool below to find specific information within the annual report.-
 1
1 -
2
-
3
-
4
-
5
-
6
-
7
-
8
-
9
-
10
-
11
-
12
-
13
-
14
-
15
-
16
-
17
-
18
-
19
-
20
-
21
-
22
-
23
-
24
-
25
-
26
-
27
-
28
-
29
-
30
-
31
-
32
-
33
-
34
-
35
-
36
-
37
-
38
-
39
-
40
-
41
-
42
-
43
-
44
-
45
-
46
-
47
-
48
-
49
-
50
-
51
-
52
-
53
-
54
-
55
-
56
-
57
-
58
-
59
-
60
-
61
-
62
-
63
-
64
-
65
-
66
-
67
-
68
-
69
-
70
-
71
-
72
-
73
-
74
-
75
-
76
-
77
-
78
-
79
-
80
-
81
-
82
-
83
-
84
-
85
-
86
-
87
-
88
-
89
-
90
-
91
-
92
-
93
-
94
-
95
-
96
-
97
-
98
-
99
-
100
-
101
-
102
-
103
-
104
-
105
-
106
-
107
-
108
-
109
-
110
-
111
-
112
-
113
-
114
-
115
-
116
-
117
-
118
-
119
-
120
-
121
-
122
-
123
-
124
-
125
-
126
-
127
-
128
-
129
-
130
-
131
-
132
-
133
-
134
-
135
-
136
-
137
-
138
-
139
-
140
-
141
-
142
-
 143
143 -
 144
144 -
 145
145 -
 146
146 -
 147
147 -
 148
148 -
 149
149 -
 150
150 -
 151
151 -
 152
152 -
 153
153 -
 154
154 -
 155
155 -
 156
156 -
 157
157 -
 158
158 -
 159
159 -
 160
160 -
 161
161 -
 162
162 -
 163
163 -
164
-
165
-
166
 |
 |

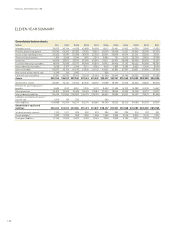
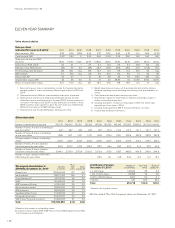
Employees
Number12011 2010 2009 2008 2007 2006 2005 2004 2003 2002 2001
Sweden 24,663 23,073 22,763 28,190 28,660 27,830 27,070 28,530 26,380 25,420 24,350
Europe, excluding Sweden 30,458 29,239 29,793 32,940 32,780 30,070 29,650 28,930 29,120 27,130 27,800
North America 15,427 12,844 12,640 14,200 15,750 14,820 15,140 14,620 12,270 12,440 12,670
South America 5,234 4,322 4,257 4,380 4,640 3,890 3,690 3,110 2,640 2,020 2,090
Asia 19,924 18,535 18,416 19,090 17,150 4,420 4,210 4,130 3,710 2,590 2,550
Other markets 2,456 2,396 2,339 2,580 2,720 2,160 2,100 1,760 1,620 1,560 1,460
Volvo Group total 98,162 90,409 90,208 101,380 101,700 83,190 81,860 81,080 75,740 71,160 70,920
1 As of 2009 regular employees are shown, previously temporary employees were also included.
Delivered units
Number 2011 2010 2009 2008 2007 2006 2005 2004 2003 2002 2001
Heavy-duty trucks (>16 tons) 179,779 123,522 82,675 179,962 172,322 179,089 172,242 152,300 120,920 120,200 117,180
Medium-duty trucks (7–15.9 tons) 34,631 30,657 21,653 30,817 27,933 14,695 18,643 18,800 15,870 16,220 17,310
Light trucks (<7 tons) 23,982 25,811 23,354 40,372 36,101 26,147 23,494 22,120 19,200 20,710 20,820
Total trucks 238,391 179,989 127,681 251,151 236,356 219,931 214,379 193,220 155,990 157,130 155,310
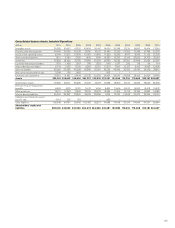
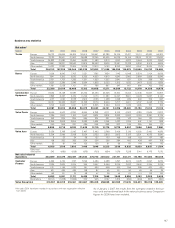
Number 2011 2010 2009 2008 2007 2006 2005 2004 2003 2002 2001
Trucks Total Europe 95,113 65,503 49,145 121,847 128,070 114,417 103,622 102,670 92,080 96,290 98,040
Western Europe 75,728 56,215 43,919 95,969 100,106 97,074 91,087 90,750 82,670 87,490 90,460
Eastern Europe 19,385 9,288 5,226 25,878 27,964 17,343 12,535 11,920 9,410 8,800 7,580
North America 42,613 24,282 17,574 30,146 33,280 70,499 64,974 49,270 34,760 36,510 34,650
South America 29,274 21,483 12,587 18,092 15,264 11,646 11,248 9,190 5,980 5,360 5,790
Asia 56,165 53,833 34,800 60,725 39,916 12,817 25,706 24,880 16,290 9,140 6,600
Other markets 15,226 14,888 13,575 20,341 19,826 10,552 8,829 7,210 6,880 9,830 10,230
Total 238,391 179,989 127,681 251,151 236,356 219,931 214,379 193,220 155,990 157,130 155,310
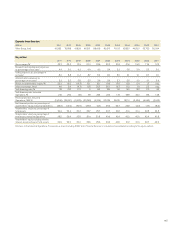
Buses Total Europe 2,695 2,395 3,164 3,313 3,748 3,570 3,723 3,417 3,087 3,413 3,115
Western Europe 2,601 2,336 2,896 3,140 3,377 3,081 3,385 3,073 2,782 3,076 2,899
Eastern Europe 94 59 268 173 371 489 338 344 305 337 216
North America 3,014 2,092 1,539 1,884 1,547 1,741 1,546 1,388 1,553 1,945 3,128
South America 2,620 1,174 690 995 1,318 1,236 2,297 624 369 495 1,009
Asia 3,417 3,477 3,839 3,033 2,757 3,349 2,554 2,341 2,227 2,639 2,209
Other markets 1,040 1,091 625 712 546 464 555 462 581 567 492
Total 12,786 10,229 9,857 9,937 9,916 10,360 10,675 8,232 7,817 9,059 9,953
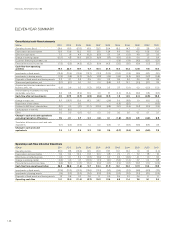
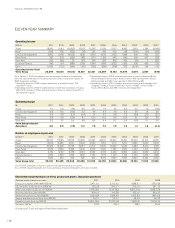
200712006 2005 2004 2003 2002 2001
2,426; 9.6 2,612; 10.5 2,683; 11.6 2,695; 13.3 2,607; 14.9 2,564; 14.5 2,586; 14.3
242; 1.0 282; 11.4 292; 1.3 293; 1.5 298; 1.7 307; 1.7 316; 1.7
7,067; 27.9 7,596; 30.6 7,419; 32.1 8,495; 42.2 8,687; 49.1 9,202; 52.0 9,187; 50.9
542; 2.1 606; 2.4 672; 2.9 645; 3.2 570; 3.3 726; 4.1 730; 4.0
1,979; 7.8 2,048; 8.3 1,960; 8.5 2,085; 10.3 1,965; 11.2 1,896; 10.7 1,816; 10.1
58; 0.2 69; 0.3 209; 0.9 184; 0.9 200; 1.1 173; 1.0 308; 1.7
27,120; 107 26,987; 108.8 23,590; 102 24,675; 122.1 21,613; 124 20,531, 116 20,306; 112
253.2 248.1 231.2 202.1 174.8 177.1 180.6
149