Volvo 2011 Annual Report Download - page 98
Download and view the complete annual report
Please find page 98 of the 2011 Volvo annual report below. You can navigate through the pages in the report by either clicking on the pages listed below, or by using the keyword search tool below to find specific information within the annual report.-
 1
1 -
2
-
3
-
4
-
5
-
6
-
7
-
8
-
9
-
10
-
11
-
12
-
13
-
14
-
15
-
16
-
17
-
18
-
19
-
20
-
21
-
22
-
23
-
24
-
25
-
26
-
27
-
28
-
29
-
30
-
31
-
32
-
33
-
34
-
35
-
36
-
37
-
38
-
39
-
40
-
41
-
42
-
43
-
44
-
45
-
46
-
47
-
48
-
49
-
50
-
51
-
52
-
53
-
54
-
55
-
56
-
57
-
58
-
59
-
60
-
61
-
62
-
63
-
64
-
65
-
66
-
67
-
68
-
69
-
70
-
71
-
72
-
73
-
74
-
75
-
76
-
77
-
78
-
79
-
80
-
81
-
82
-
83
-
84
-
85
-
86
-
87
-
 88
88 -
 89
89 -
 90
90 -
 91
91 -
 92
92 -
 93
93 -
 94
94 -
 95
95 -
 96
96 -
 97
97 -
 98
98 -
 99
99 -
 100
100 -
 101
101 -
 102
102 -
 103
103 -
 104
104 -
 105
105 -
 106
106 -
 107
107 -
 108
108 -
109
-
110
-
111
-
112
-
113
-
114
-
115
-
116
-
117
-
118
-
119
-
120
-
121
-
122
-
123
-
124
-
125
-
126
-
127
-
128
-
129
-
130
-
131
-
132
-
133
-
134
-
135
-
136
-
137
-
138
-
139
-
140
-
141
-
142
-
143
-
144
-
145
-
146
-
147
-
148
-
149
-
150
-
151
-
152
-
153
-
154
-
155
-
156
-
157
-
158
-
159
-
160
-
161
-
162
-
163
-
164
-
165
-
166
 |
 |

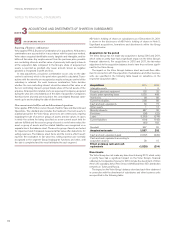
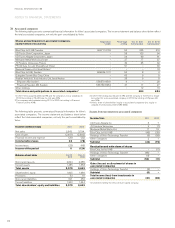
Reporting by product area
The Volvo Group’s operations are, until year end 2011, organized in nine
business areas: Volvo Trucks, Renault Trucks, North American Trucks,
Trucks Asia, Buses, Construction Equipment, Volvo Penta, Volvo Aero and
Customer Finance. In addition to the nine business areas, there are other
operations consisting mainly of business units that are designed to sup-
port the business areas’ operations. The business units include Volvo
Powertrain, Volvo 3P, Volvo IT, Volvo Logistics and Volvo Parts. As the four
truck brands share product development, production and other activities
in business units such as Volvo 3P and Volvo Powertrain and also share
certain infrastructure in distribution such as dealers, the four truck brands
are reported as one aggregated business segment. The Volvo Group is
thus reported divided in six segments in which net sales and operating
income are reported for each product area.
Each business area, except for Customer Finance, has total responsi-
bility for its operating income, operating capital and operating cash flow.
Volvo Financial Services within Customer Finance has responsibility for
its net income and total balance sheet within certain restrictions and prin-
ciples that are established centrally. The supervision and coordination of
treasury and tax matters is organized centrally to obtain the benefits of a
Group-wide approach. The legal structure of the Volvo Group is based on
optimal handling of treasury, tax and administrative matters and, accord-
ingly, differs from the operating structure.
The business units are designated to support the business areas and
are therefore not reportable business segments. The results from the syn-
ergies created in the business units are transferred back to the various
product areas based on the degree to which individual areas have utilized
the services of the business units. The heading Other contains mainly
earnings linked to corporate functions including the Group’s treasury
operations. The Group’s real estate, held in Volvo Group Real Estate, is
reported under industrial operations, and earnings are transferred back to
the business areas.
Reported segment information is based on the information used inter-
nally by the chief operating decision maker, which in Volvo is the Volvo
Group Executive Committee.
As from January 1, 2012, the Volvo Group has a new organizational
structure (see pages 8-9 in this report). The business will continue to be
divided in six segments under the new organization. The organizational
change may however result in some shifts between the segments.
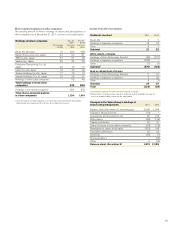
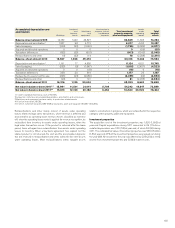
Net sales 2011 2010
Trucks 200,703 167,305
Construction Equipment 64,987 53,810
Buses 22,289 20,516
Volvo Penta 8,859 8,716
Volvo Aero 6,509 7,708
Other and eliminations 242 (680)
Industrial Operations 303,589 257,375
Customer Finance 8,883 9,031
Reclassifications and eliminations (2,104) (1,657)
Volvo Group 310,367 264,749
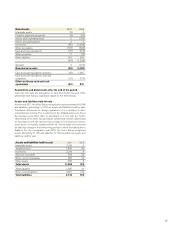
The above sales figures include internal sales in the following amounts:
Net sales to Group companies 2011 2010
Trucks 1,921 1,421
Construction Equipment 606 347
Buses 526 490
Volvo Penta 140 129
Volvo Aero 1 21
Other and eliminations (1,426) (984)
Industrial Operations 1,769 1,424
Customer Finance 337 231
Eliminations (2,106) (1,655)
Volvo Group 0 0
Internal sales between business areas are generally made at standard
cost of sales, including calculated interest and product improvement
expenses. Internal sales from service companies are generally made at
market prices.
Operating income 2011 2010
Trucks 18,260 10,112
Construction Equipment 6,653 6,180
Buses 1,036 780
Volvo Penta 781 578
Volvo Aero 336 286
Other (1,109) (102)
Industrial Operations 25,957 17,834
Customer Finance 942 167
Volvo Group 26,899 18,000
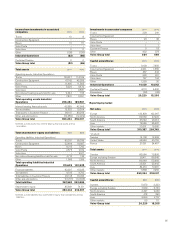
Depreciation and amortization 2011 2010
Trucks 8,531 8,721
Construction Equipment 1,903 1,975
Buses 472 464
Volvo Penta 474 453
Volvo Aero 504 436
Other (464) (710)
Industrial Operations 11,419 11,338
Customer Finance 2,572 2,454
Volvo Group total113,992 13,792
1 Of which write-down 102 (33).
Research and development expenses 2011 2010
Trucks 8,627 9,230
Construction Equipment 2,556 1,972
Buses 1,052 882
Volvo Penta 692 670
Volvo Aero 275 156
Other 74 60
Volvo Group total 13,276 12,970
SEGMENT REPORTING
6
NOTE
NOTES TO FINANCIAL STATEMENTS
FINANCIAL INFORMATION 2011
94