Volvo 2011 Annual Report Download - page 119
Download and view the complete annual report
Please find page 119 of the 2011 Volvo annual report below. You can navigate through the pages in the report by either clicking on the pages listed below, or by using the keyword search tool below to find specific information within the annual report.-
 1
1 -
2
-
3
-
4
-
5
-
6
-
7
-
8
-
9
-
10
-
11
-
12
-
13
-
14
-
15
-
16
-
17
-
18
-
19
-
20
-
21
-
22
-
23
-
24
-
25
-
26
-
27
-
28
-
29
-
30
-
31
-
32
-
33
-
34
-
35
-
36
-
37
-
38
-
39
-
40
-
41
-
42
-
43
-
44
-
45
-
46
-
47
-
48
-
49
-
50
-
51
-
52
-
53
-
54
-
55
-
56
-
57
-
58
-
59
-
60
-
61
-
62
-
63
-
64
-
65
-
66
-
67
-
68
-
69
-
70
-
71
-
72
-
73
-
74
-
75
-
76
-
77
-
78
-
79
-
80
-
81
-
82
-
83
-
84
-
85
-
86
-
87
-
88
-
89
-
90
-
91
-
92
-
93
-
94
-
95
-
96
-
97
-
98
-
99
-
100
-
101
-
102
-
103
-
104
-
105
-
106
-
107
-
108
-
 109
109 -
 110
110 -
 111
111 -
 112
112 -
 113
113 -
 114
114 -
 115
115 -
 116
116 -
 117
117 -
 118
118 -
 119
119 -
 120
120 -
 121
121 -
 122
122 -
 123
123 -
 124
124 -
 125
125 -
 126
126 -
 127
127 -
 128
128 -
 129
129 -
130
-
131
-
132
-
133
-
134
-
135
-
136
-
137
-
138
-
139
-
140
-
141
-
142
-
143
-
144
-
145
-
146
-
147
-
148
-
149
-
150
-
151
-
152
-
153
-
154
-
155
-
156
-
157
-
158
-
159
-
160
-
161
-
162
-
163
-
164
-
165
-
166
 |
 |

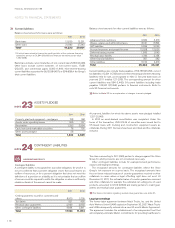
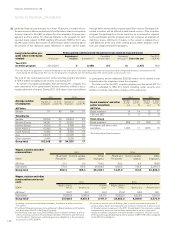
LIABILITIES
22
NOTE
Non-current liabilities
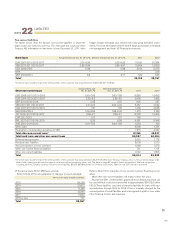
The tables below show the Group’s non-current liabilities in which the
largest loans are listed by currency. The main part are issued by Volvo
Treasury AB. Information on loan terms is from December 31, 2011. Volvo
Bond loans Actual interest rate Dec 31, 2011, % Effectiveinterest rate Dec 31, 2011, % 2011 2010
EUR 2007–2011/2013-2017 2.01–9.92 2.03–9.92 16,591 20,384
SEK 2007–2011/2013–2017 2.82–5.84 2.85–5.97 15,904 12,553
USD 2009/2015 5.98 5.98 5,165 5,075
NOK – – – 229
GBP 2009/2014 6.6 6.77 532 525
Total1 38,192 38,767
1 Of which loans raised to finance the credit portfolio of the customer financing operations totalled 24,501 (14,940).
Other non-current loans Actual interest rate
Dec 31, 2011, % Effectiveinterest rate
Dec 31, 2011, % 2011 2010
USD 2008–2011/2013–2018 0.63–7.66 0.63–7.66 8,883 13,433
EUR 2004–2010/2013–2027 2.82–6.5 2.85–6.5 2,409 1,485
GBP 2011/2013–2014 2.45 2.47 925 337
SEK 2007–2011/2013–2017 2.9–4.22 2.93–4.22 5,457 2,942
CAD 2007–2011/2013–2016 1.81 1.82 1,439 2,928
MXN 2009/2014 7.43–8.96 7.68–9.34 1,470 2,186
JPY 2006–2011/2013–2017 0.59–2.1 0.59–2.1 13,132 12,405
CHF 2011/2013 1.07 1.07 736 –
BRL 2007–2011/2016–2019 6.33 6.58 5,081 5,348
AUD 2010–2011/2013 5.91–7.50 6.04–7.64 1,054 140
Other loans 5,509 1,731
Revaluation of outstanding derivatives to SEK 1,670 2,392
Total other non-current loans1 47,765 45,327
Total bond loans and other non-current loans 85,957 84,094
Deferred leasing income 2,000 1,778
Residual value liabilities 3,608 3,170
Accrued expenses service contracts 1,996 1,273
Other non-current financial liabilities 701 1,114
Other non-current liabilities 2,142 1,896
Total 96,404 93,325
1 Of which loans raised to finance the credit portfolio of the customer financing operations 24,517 (21,064). Volvo Treasury employs cross-currency interest swaps to be
able to offer lending and borrowing in various currencies without increasing Volvo’s risk. The table on page 87 presents Industrial operations financial net position,
including pensions, listed by currency. Of non-current liabilities, 87,923 (86,184) pertains to financial instruments. Refer to note 30 Financial instruments.
Of the above loans, 516 (1,288) was secured.
Refer to Note 23 for an explanation of changes to assets pledged.
Non-currentloans mature as follows:
2013 28,228
2014 20,912
2015 11,356
2016 12,954
2017 11,800
2018 or later 707
Total 85,957
Refer to Note 15 for maturities of non-current customer financing receiv-
ables.
Most other non-current liabilities will mature within five years.
At year-end 2011, credit facilities granted but not utilized and which can
be used without restrictions amounted to approximately SEK 33.6 billion
(35.3). These facilities consisted of stand-by facilities for loans with vary-
ing maturities through 2013 to 2016. A fee is normally charged for the
unused portion of credit facilities and is recognized in profit or loss under
other financial income and expenses.
hedges foreign-exchange and interest-rate risks using derivative instru-
ments. For more information refer to Note 4 Goals and policies in financial
risk management and Note 30 Financial Instruments.
115