Volvo 2011 Annual Report Download - page 91
Download and view the complete annual report
Please find page 91 of the 2011 Volvo annual report below. You can navigate through the pages in the report by either clicking on the pages listed below, or by using the keyword search tool below to find specific information within the annual report.-
 1
1 -
2
-
3
-
4
-
5
-
6
-
7
-
8
-
9
-
10
-
11
-
12
-
13
-
14
-
15
-
16
-
17
-
18
-
19
-
20
-
21
-
22
-
23
-
24
-
25
-
26
-
27
-
28
-
29
-
30
-
31
-
32
-
33
-
34
-
35
-
36
-
37
-
38
-
39
-
40
-
41
-
42
-
43
-
44
-
45
-
46
-
47
-
48
-
49
-
50
-
51
-
52
-
53
-
54
-
55
-
56
-
57
-
58
-
59
-
60
-
61
-
62
-
63
-
64
-
65
-
66
-
67
-
68
-
69
-
70
-
71
-
72
-
73
-
74
-
75
-
76
-
77
-
78
-
79
-
80
-
 81
81 -
 82
82 -
 83
83 -
 84
84 -
 85
85 -
 86
86 -
 87
87 -
 88
88 -
 89
89 -
 90
90 -
 91
91 -
 92
92 -
 93
93 -
 94
94 -
 95
95 -
 96
96 -
 97
97 -
 98
98 -
 99
99 -
 100
100 -
 101
101 -
102
-
103
-
104
-
105
-
106
-
107
-
108
-
109
-
110
-
111
-
112
-
113
-
114
-
115
-
116
-
117
-
118
-
119
-
120
-
121
-
122
-
123
-
124
-
125
-
126
-
127
-
128
-
129
-
130
-
131
-
132
-
133
-
134
-
135
-
136
-
137
-
138
-
139
-
140
-
141
-
142
-
143
-
144
-
145
-
146
-
147
-
148
-
149
-
150
-
151
-
152
-
153
-
154
-
155
-
156
-
157
-
158
-
159
-
160
-
161
-
162
-
163
-
164
-
165
-
166
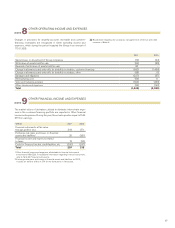
 |
 |
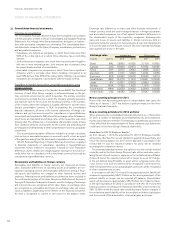
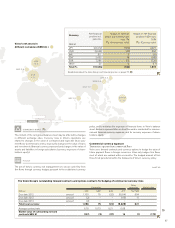
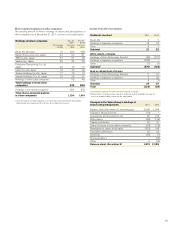
Currencies Other
currencies Market value
Millions USD GBP EUR JPY Net SEK
Due date 2012 amount 1,100 75 (22) (5,514) 604
Due date 2013 amount (2) – – (115) 17
Due date 2014 amount (2) – – – -
Total local currency 1,096 75 (22) (5,629) 621
Average contract rate 6.76 10.73 9.21 0.08
Market value of outstanding forward
contracts SEK M (147) (3) (37) 16 (1) (172)
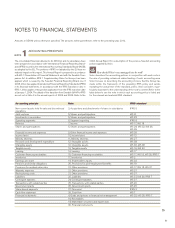
The Volvo Group’s outstanding forward contracts and options contracts for hedging of commercial currency risks
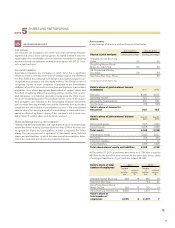
CURRENCY RISKS B
The content of the recognized balance sheet may be affected by changes
in different exchange rates. Currency risks in Volvo’s operations are
related to changes in the value of contracted and expected future pay-
ment flows (commercial currency exposure), changes in the value of loans
and investments (financial currency exposure) and changes in the value of
assets and liabilities in foreign subsidiaries (currency exposure of share-
holders’ equity).
POLICY
The aim of Volvo’s currency risk management is to secure cash flow from
firm flows through currency hedges pursuant to the established currency
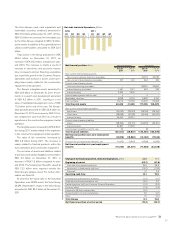
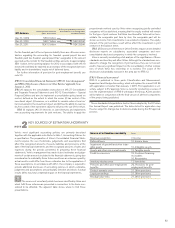
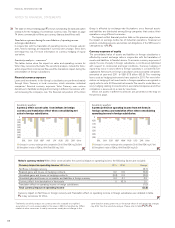
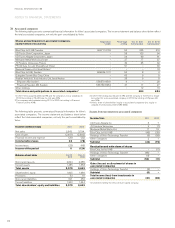
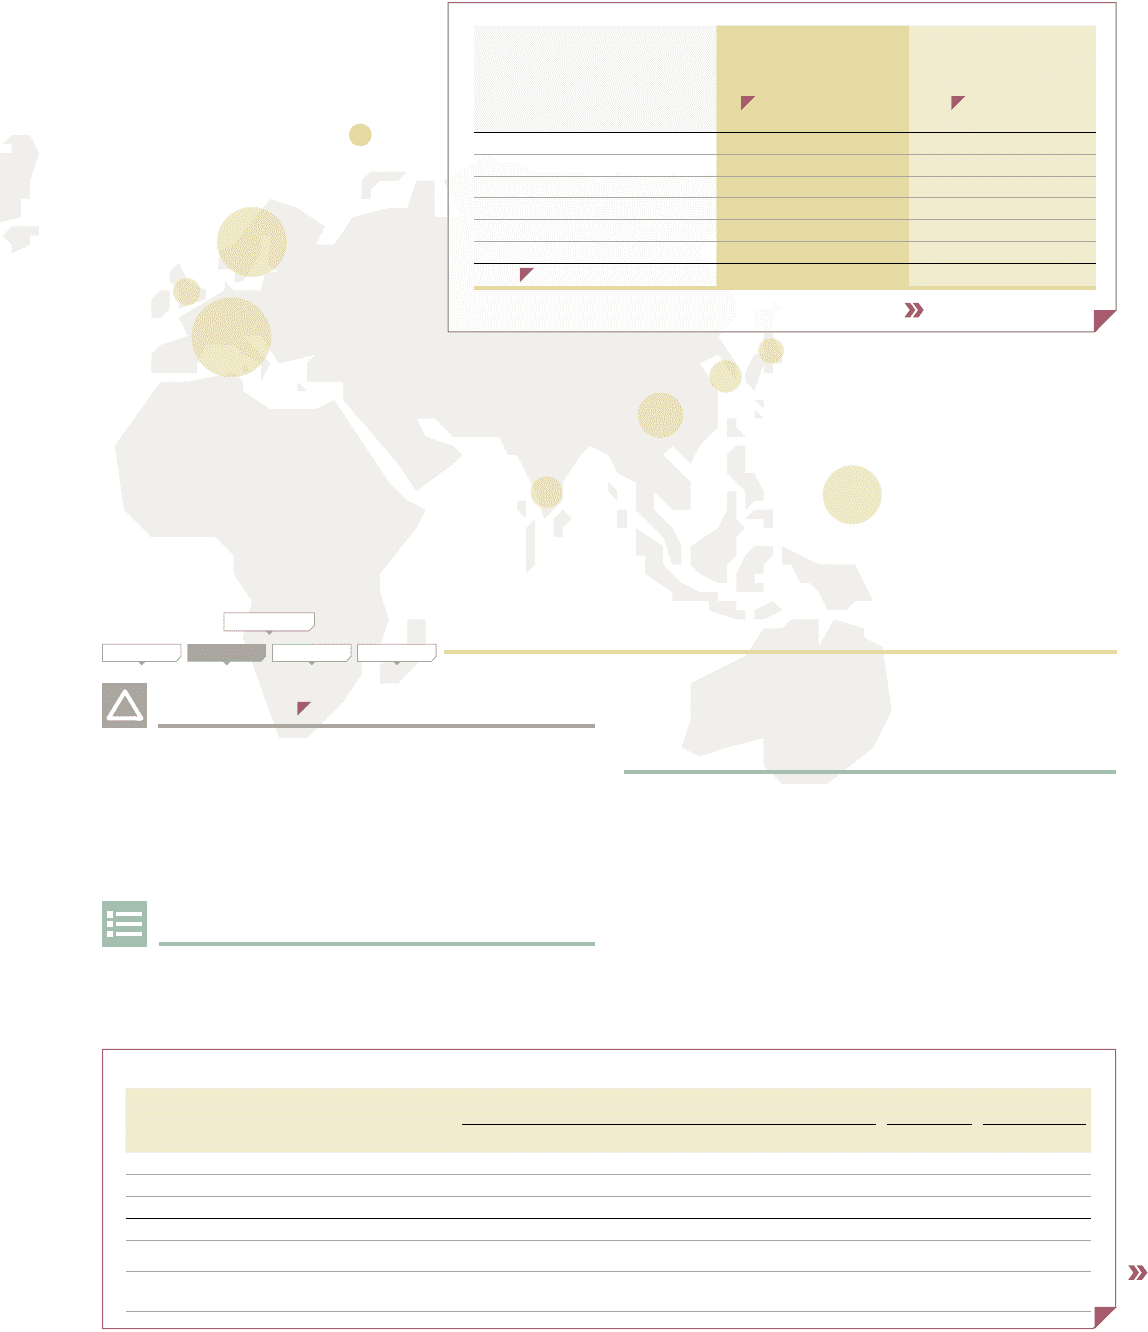
CURRENCY RISKS
D
Currency Net financial
position incl.
pensions
Impact onearnings
before tax if interest rate
rises 1%
A (Interest-rate risks)
Impact on Net financial
position if SEK rises
10%
B
(Currency risks)
SEK M
JPY (24,272) (182) 2,427
USD (5,644) (42) 564
INR 811 6 (81)
CNY 2,453 18 (245)
EUR 7,286 55 (729)
Other 20 0 (17)
Total C (19,346) (145) 1,919
Read more about the Volvo Group’s net financial position on page 77.
F
cont. >>
policy, and to minimize the exposure of financial items in Volvo’s balance
sheet. Below is a presentation on how this work is conducted for commer-
cial and financial currency exposure, and for currency exposure of share-
holders’ equity.
Commercial currency exposure
Transaction exposure from commercial flows
Volvo uses forward contracts and currency options to hedge the value of
future payment flows in foreign currencies. Volvo only hedges firm flows,
most of which are realized within six months. The hedged amount of firm
flows for all periods fall within the framework of Volvo’s currency policy.
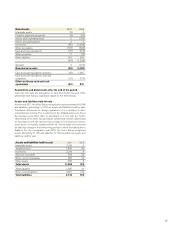
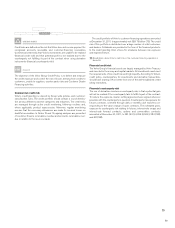
Volvo’s net assets in
different currencies (SEK bn) =
SEK
16.9
GBP 2.6
CNY 7.2
INR 3.5
JPY 2.3
KRW 3.6
OTHER
12.0
EUR
22.1
87