Volvo 2011 Annual Report Download - page 124
Download and view the complete annual report
Please find page 124 of the 2011 Volvo annual report below. You can navigate through the pages in the report by either clicking on the pages listed below, or by using the keyword search tool below to find specific information within the annual report.-
 1
1 -
2
-
3
-
4
-
5
-
6
-
7
-
8
-
9
-
10
-
11
-
12
-
13
-
14
-
15
-
16
-
17
-
18
-
19
-
20
-
21
-
22
-
23
-
24
-
25
-
26
-
27
-
28
-
29
-
30
-
31
-
32
-
33
-
34
-
35
-
36
-
37
-
38
-
39
-
40
-
41
-
42
-
43
-
44
-
45
-
46
-
47
-
48
-
49
-
50
-
51
-
52
-
53
-
54
-
55
-
56
-
57
-
58
-
59
-
60
-
61
-
62
-
63
-
64
-
65
-
66
-
67
-
68
-
69
-
70
-
71
-
72
-
73
-
74
-
75
-
76
-
77
-
78
-
79
-
80
-
81
-
82
-
83
-
84
-
85
-
86
-
87
-
88
-
89
-
90
-
91
-
92
-
93
-
94
-
95
-
96
-
97
-
98
-
99
-
100
-
101
-
102
-
103
-
104
-
105
-
106
-
107
-
108
-
109
-
110
-
111
-
112
-
113
-
 114
114 -
 115
115 -
 116
116 -
 117
117 -
 118
118 -
 119
119 -
 120
120 -
 121
121 -
 122
122 -
 123
123 -
 124
124 -
 125
125 -
 126
126 -
 127
127 -
 128
128 -
 129
129 -
 130
130 -
 131
131 -
 132
132 -
 133
133 -
 134
134 -
135
-
136
-
137
-
138
-
139
-
140
-
141
-
142
-
143
-
144
-
145
-
146
-
147
-
148
-
149
-
150
-
151
-
152
-
153
-
154
-
155
-
156
-
157
-
158
-
159
-
160
-
161
-
162
-
163
-
164
-
165
-
166
 |
 |
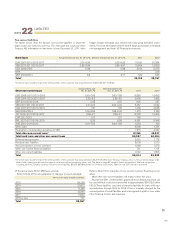
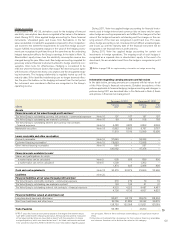
Wages, salaries and other
remunerations 2011 2010
SEK M
Board and
Presidents1
of which variable
salaries
Other
employees
Board and
Presidents1
of which variable
salaries
Other
employees
AB Volvo 31.5 9.9 199.2 26.2 8.0 184.6
Subsidiaries 770.9 175.5 36,036.9 1,005.0 104.8 32,647.4
Group total 802.4 185.4 36,236.1 1,031.2 112.8 32,832.0
Wages, salaries and other
remunerations and social
costs 2011 2010
SEK M Wages, salaries
remun. Social costs Pension
costs Wages, salaries
remun. Social costs Pension costs4
AB Volvo2230.7 68.1 34.0 210.8 60.8 59.1
Subsidiaries 36,807.8 8,583.5 3,437.0 33,652.4 8,308.8 3,514.8
Group total337,038.5 8,651.6 3,471.0 33,863.2 8,369.6 3,573.9
1 Including current and former Board members, Presidents and Executive Vice
Presidents.
2 The Parent Company’s pension costs, pertaining to Board members and Presidents
are disclosed in Note 3 in the Parent Company.
3 Of the Group’s pension costs, 96.8 (146.6) pertain to Board members and Pres-
idents, including current and former Board members, Presidents and Executive
Vice Presidents. The Group’s outstanding pension obligations to these individu-
als amount to 337.7 (334.4).
4 In certain countries, such as Sweden, part of social cost relate to pensions. In
previous years, Volvo has reclassified such portion of social cost to pension cost
for Swedish group companies. In the 2011 Annual Report, these pension related
components of social cost has not been reclassified to pension cost, which
makes for a better comparison with other Swedish companies. Pension cost for
2010 has been adjusted downwards with an amount of SEK 1,166 million compared
to the 2010 Annual Report.
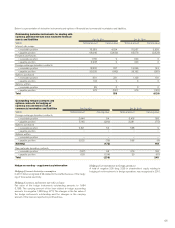
2011 2010
Average number
of employees Number of
employees ofwhich
women, % Number of
employees ofwhich
women, %
AB Volvo
Sweden 171 49 198 51
Subsidiaries
Sweden 24,793 20 23,313 20
Western Europe 24,241 17 23,515 17
Eastern Europe 6,220 21 5,768 22
North America 15,380 18 12,429 19
South America 6,080 14 5,264 14
Asia 22,915 11 21,205 10
Other countries 2,448 17 2,558 15
Group total 102,248 18 94,250 17
2011 2010
Board members1 and other
senior executives
Number
at year-
end
ofwhich
women,
%
Number
at year-
end
ofwhich
women,
%
AB Volvo
Board members114 14 12 17
CEO and GEC 17 6 17 6
Volvo Group
Board members1898 13 929 12
Presidentsand other senior
executives 1,034 17 1,053 15
1 Excluding deputy Board members.
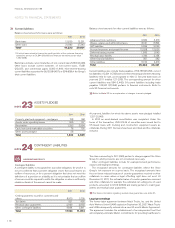
Long term incentive pro-
gram (share settled plan
version)
Shares granted conditional under the plan but not yet alloted (in thousand shares)
Vesting year Beginning of
the year Granted 2011 Cancelled/
forfeited 2011 Allotments
during 2011 End of the year Cost 2011
(SEK M)1
Year 2011
incentive program 2014/2015 0 2,488 (11) (1) 2,476 69.8
1 The fair value of the payments is determined based on the share price at the grant date reduced by the discounted value of expected dividends connected with the
share during the vesting period. The cost for the program is recognized over the vesting period. The cost includes social security cost.
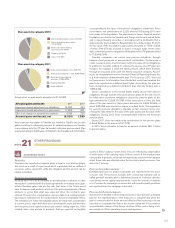
particular financial year amounts to at least 10 percent, a number of per-
formance shares. Maximum allotment of performance shares corresponds
to seven shares for the CEO, six shares for other members of group man-
agement and five shares for other participants in the program for each
invested share, subject to ROE reaching 25 percent. ROE for 2011 was
23.1%, which means that number of performance shares reached about
90 percent of the maximum grant. Allotment of shares will be made
through Volvo owned, earlier re-purchased, Volvo shares. Participants in
certain countries will be offered a cash-based version of the incentive
program. For participants in these countries, no investment is required
by the participant and the program does not comprise an element of
matching shares. Allotment of shares in this version is replaced by a
cash allotment at the end of the vesting period. Other program condi-
tions are similar between the programs.
The cost for the cash-based version of the incentive program amounted
to SEK 4 million including social security cost during 2011.
A number of program participants that are leaving the company has
been determined to be “good leavers” and are therefore entitled to accu-
mulated allotment of shares. During 2011, 929 shares have been alloted
to participants, and an additional 203,520 shares will be alloted to par-
ticipants when the employees leave the company.
The total cost for the 2011 incentive program over the period 2011 to
2014 is estimated to SEK 273 million including social security cost.
Actual cost will be impacted by changes in the share price.
NOTES TO FINANCIAL STATEMENTS
FINANCIAL INFORMATION 2011
120