Volvo 2011 Annual Report Download - page 79
Download and view the complete annual report
Please find page 79 of the 2011 Volvo annual report below. You can navigate through the pages in the report by either clicking on the pages listed below, or by using the keyword search tool below to find specific information within the annual report.-
 1
1 -
2
-
3
-
4
-
5
-
6
-
7
-
8
-
9
-
10
-
11
-
12
-
13
-
14
-
15
-
16
-
17
-
18
-
19
-
20
-
21
-
22
-
23
-
24
-
25
-
26
-
27
-
28
-
29
-
30
-
31
-
32
-
33
-
34
-
35
-
36
-
37
-
38
-
39
-
40
-
41
-
42
-
43
-
44
-
45
-
46
-
47
-
48
-
49
-
50
-
51
-
52
-
53
-
54
-
55
-
56
-
57
-
58
-
59
-
60
-
61
-
62
-
63
-
64
-
65
-
66
-
67
-
68
-
 69
69 -
 70
70 -
 71
71 -
 72
72 -
 73
73 -
 74
74 -
 75
75 -
 76
76 -
 77
77 -
 78
78 -
 79
79 -
 80
80 -
 81
81 -
 82
82 -
 83
83 -
 84
84 -
 85
85 -
 86
86 -
 87
87 -
 88
88 -
 89
89 -
90
-
91
-
92
-
93
-
94
-
95
-
96
-
97
-
98
-
99
-
100
-
101
-
102
-
103
-
104
-
105
-
106
-
107
-
108
-
109
-
110
-
111
-
112
-
113
-
114
-
115
-
116
-
117
-
118
-
119
-
120
-
121
-
122
-
123
-
124
-
125
-
126
-
127
-
128
-
129
-
130
-
131
-
132
-
133
-
134
-
135
-
136
-
137
-
138
-
139
-
140
-
141
-
142
-
143
-
144
-
145
-
146
-
147
-
148
-
149
-
150
-
151
-
152
-
153
-
154
-
155
-
156
-
157
-
158
-
159
-
160
-
161
-
162
-
163
-
164
-
165
-
166
 |
 |
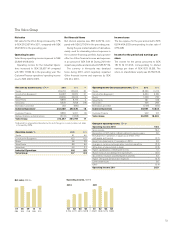
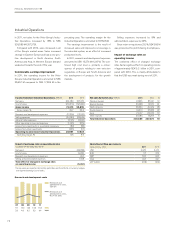
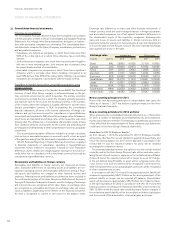
Total new financing volume in 2011 amounted
to SEK 44.8 billion (35.1). Adjusted for changes
in exchange rates, new business volume
increased by 35% compared to 2010 as a
result of increased sales volumes of the Volvo
Group products and stable penetration levels.
In total, 49,757 new Volvo vehicles and
machines (34,522) were financed during the
year. In the markets where financing is offered,
the average penetration rate was 25% (25).
As of December 31, 2011, the credit portfolio
was SEK 95,544 M (84,550). During 2011 the
credit portfolio increased by 13.8% (decrease: 4.4),
adjusted for exchange-rate movements. The
funding of the credit portfolio is matched in
terms of maturity, interest rates and currencies
in accordance with Volvo Group policy. For fur-
ther information see note 15.
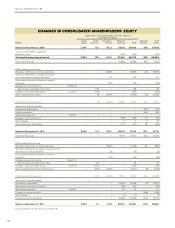
The operating income for the year amounted
to SEK 942 M compared to SEK 167 M in the
previous year. Return on shareholders’ equity
was 7.3% (0.4). The equity ratio at the end of
the year was 9.1% (9.0). The improvement in
profitability is driven mainly by lower credit pro-
visions and higher earning assets. During the
year, credit provision expenses amounted to
SEK 682 M (1,438) while write-offs of SEK 804
M (1,460) were recorded. The write-off ratio for
2011 was 0.93% (1.65). At the end of December
31, 2011, credit reserves were 1.33% (1.69%)
of the credit portfolio.
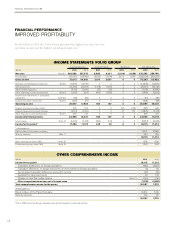
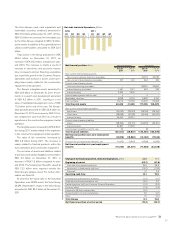
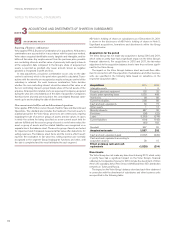
Income Statement Customer Finance, SEK M 2011 2010
Finance and lease income 8,883 9,031
Finance and lease expenses (5,693) (5,974)
Gross income 3,190 3,057
Selling and administrative expenses (1,645) (1,526)
Credit provision expenses (682) (1,438)
Other operating income and expenses 78 73
Operating income (loss) 942 167
Income taxes (323) (134)
Income (Loss) for the period 619 32
Return on Equity 7.3 0.4
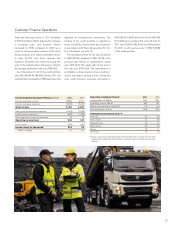
Key ratios, Customer Finance1 2011 2010
Credit portfolio net, SEK bn 94.3 83.1
Operating income, SEK M 942 167
Return on shareholders' equity, % 7.3 0.4
Total penetration rate, % 24.8 24.5
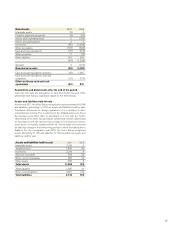
Penetration by business area1, %
Volvo CE 35 35
Volvo Trucks 27 29
Renualt Trucks 19 17
MackTrucks 20 20
Buses 15 11
UD Trucks 14 12
1 Share of unit sales financed by Volvo Financial Services in relation to the total
number units sold by the Volvo Group in markets where financial services are
offered.
Customer Finance Operations
75