Volvo 2011 Annual Report Download - page 70
Download and view the complete annual report
Please find page 70 of the 2011 Volvo annual report below. You can navigate through the pages in the report by either clicking on the pages listed below, or by using the keyword search tool below to find specific information within the annual report.-
 1
1 -
2
-
3
-
4
-
5
-
6
-
7
-
8
-
9
-
10
-
11
-
12
-
13
-
14
-
15
-
16
-
17
-
18
-
19
-
20
-
21
-
22
-
23
-
24
-
25
-
26
-
27
-
28
-
29
-
30
-
31
-
32
-
33
-
34
-
35
-
36
-
37
-
38
-
39
-
40
-
41
-
42
-
43
-
44
-
45
-
46
-
47
-
48
-
49
-
50
-
51
-
52
-
53
-
54
-
55
-
56
-
57
-
58
-
59
-
 60
60 -
 61
61 -
 62
62 -
 63
63 -
 64
64 -
 65
65 -
 66
66 -
 67
67 -
 68
68 -
 69
69 -
 70
70 -
 71
71 -
 72
72 -
 73
73 -
 74
74 -
 75
75 -
 76
76 -
 77
77 -
 78
78 -
 79
79 -
 80
80 -
81
-
82
-
83
-
84
-
85
-
86
-
87
-
88
-
89
-
90
-
91
-
92
-
93
-
94
-
95
-
96
-
97
-
98
-
99
-
100
-
101
-
102
-
103
-
104
-
105
-
106
-
107
-
108
-
109
-
110
-
111
-
112
-
113
-
114
-
115
-
116
-
117
-
118
-
119
-
120
-
121
-
122
-
123
-
124
-
125
-
126
-
127
-
128
-
129
-
130
-
131
-
132
-
133
-
134
-
135
-
136
-
137
-
138
-
139
-
140
-
141
-
142
-
143
-
144
-
145
-
146
-
147
-
148
-
149
-
150
-
151
-
152
-
153
-
154
-
155
-
156
-
157
-
158
-
159
-
160
-
161
-
162
-
163
-
164
-
165
-
166
 |
 |

By developing long-term relationships with cus-
tomers and dealers, VFS seeks to establish a
number one market position for the financing of
Volvo Group products where we operate.
When customers choose a vehicle or equipment
supplier, the offer of supplementary services is
an important factor. Customers desire solutions
that can enable them to work more efficiently
while maximizing profitability and reliability. VFS
creates value for Volvo Group customers by pro-
viding solutions including financing, leasing and
insurance. These services are of increasing impor-
tance to the Volvo Group’s total offer.
Portfolio improvements
Although global economies and financial markets
continued to be characterized by uncertainty and
volatility during 2011, the VFS portfolio showed
strong improvements in customer repayment
patterns as evidenced by continued reductions
in customer delinquencies, defaults and repos-
sessions. During this period, VFS also success-
fully reduced inventories of repossessed units
as used truck and equipment demand increased.
Reduced credit losses have primarily contributed
to VFS’ increased profitability during the year.
Volvo Group unit deliveries strengthened and
financing market shares remained stable during
2011. As a result, VFS returned to growth with a
disciplined approach to balancing new business
development with risk and cost control.
Market development
VFS continues to strengthen and standardize its
operations in ways that increase efficiency,
execution and speed to market. This approach
has prepared VFS to capitalize on profitable
growth opportunities with stable, efficient and
scalable business platforms.
In the mature markets of North America and
Europe, VFS continues to improve operational
leverage and optimize results with standard
technologies, solutions and shared services. In
developing markets such as China, Russia and
Brazil, VFS continues to make investments in
prudent growth with a focus on strengthening
local operations and maintaining a disciplined
risk management structure. Downturn prepara-
tion and readiness are always in focus for such
markets regardless of the current business envi-
ronment. In India, VFS serves the market with a
branded private label alliance in support of Volvo
Group unit sales.
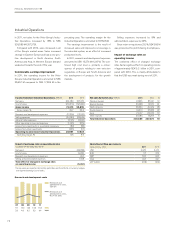
Customer finance operations
Total new financing volume in 2011 amounted to
SEK 44.8 billion (35.1). Adjusted for changes in
exchange rates, new business volume increased
by 35% compared to 2010 as a result of increased
sales volumes of the Volvo Group products and
stable penetration levels. In total, 49,757 new
Volvo vehicles and machines (34,522) were
financed during the year. In the markets where
financing is offered, the average penetration
rate was 25% (25).
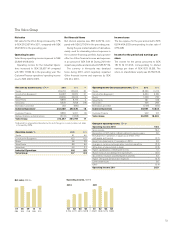
As of December 31, 2011, the credit portfolio
was SEK 95,544 M (84,550). During 2011 the
credit portfolio increased by 13.8% (decrease:
4.4), adjusted for exchange-rate movements.
The funding of the credit portfolio is matched in
terms of maturity, interest rates and currencies
in accordance with Volvo Group policy. For fur-
ther information see note 4.
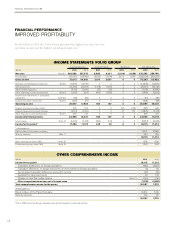
The operating income for the year amounted
to SEK 942 M compared to SEK 167 M in the
previous year. Return on shareholders’ equity
was 7.3% (0.4). The equity ratio at the end of the
year was 9.1% (9.0). The improvement in profit-
ability is driven mainly by lower credit provisions
and higher earning assets. During the year,
credit provision expenses amounted to SEK
682 M (1,438) while write-offs of SEK 804 M
(1,460) were recorded. The write-off ratio for
2011 was 0.93% (1.65). At the end of December
31, 2011, credit reserves were 1.33% (1.69%) of
the credit portfolio.
As a consequence of the strong volume
growth in Brazil, VFS executed on its second
large portfolio syndication in the second quarter
of 2011. This transaction of approximately SEK
4 billion of the Brazilian credit portfolio served
as an important risk mitigation measure and
successfully freed up capital for reinvestment in
the country. The transaction generated a posi-
tive impact on operating income of SEK 45 M.
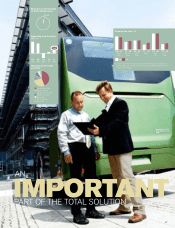
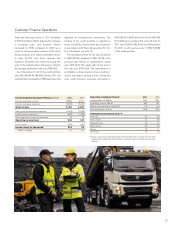
Volvo Financial Services (VFS) supports the Volvo Group product range with financial services by delivering
integrated, competitive financial solutions that meet customer and dealer needs.
VOLVO FINANCIAL SERVICES
INCREASED PROFITABILITY AND GROWTH
Conducts operations in customer and dealer financing.
Number of employees
1,323
Position on world market
Volvo Financial Services operates exclusively to sup-
port the sales and leasing of vehicles and machines
which are produced by the other business areas,
enhancing their competitiveness.
BOARD OF DIRECTORS’ REPORT 2011
66