Volvo 2011 Annual Report Download - page 6
Download and view the complete annual report
Please find page 6 of the 2011 Volvo annual report below. You can navigate through the pages in the report by either clicking on the pages listed below, or by using the keyword search tool below to find specific information within the annual report.-
 1
1 -
 2
2 -
 3
3 -
 4
4 -
 5
5 -
 6
6 -
 7
7 -
 8
8 -
 9
9 -
 10
10 -
 11
11 -
 12
12 -
 13
13 -
 14
14 -
 15
15 -
 16
16 -
 17
17 -
18
-
19
-
20
-
21
-
22
-
23
-
24
-
25
-
26
-
27
-
28
-
29
-
30
-
31
-
32
-
33
-
34
-
35
-
36
-
37
-
38
-
39
-
40
-
41
-
42
-
43
-
44
-
45
-
46
-
47
-
48
-
49
-
50
-
51
-
52
-
53
-
54
-
55
-
56
-
57
-
58
-
59
-
60
-
61
-
62
-
63
-
64
-
65
-
66
-
67
-
68
-
69
-
70
-
71
-
72
-
73
-
74
-
75
-
76
-
77
-
78
-
79
-
80
-
81
-
82
-
83
-
84
-
85
-
86
-
87
-
88
-
89
-
90
-
91
-
92
-
93
-
94
-
95
-
96
-
97
-
98
-
99
-
100
-
101
-
102
-
103
-
104
-
105
-
106
-
107
-
108
-
109
-
110
-
111
-
112
-
113
-
114
-
115
-
116
-
117
-
118
-
119
-
120
-
121
-
122
-
123
-
124
-
125
-
126
-
127
-
128
-
129
-
130
-
131
-
132
-
133
-
134
-
135
-
136
-
137
-
138
-
139
-
140
-
141
-
142
-
143
-
144
-
145
-
146
-
147
-
148
-
149
-
150
-
151
-
152
-
153
-
154
-
155
-
156
-
157
-
158
-
159
-
160
-
161
-
162
-
163
-
164
-
165
-
166
 |
 |

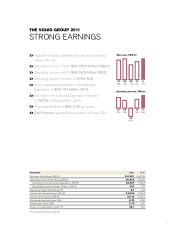
A GLOBAL GROUP 2011
A record year. That is one way of summing up 2011. We put the best
year ever under our belt and I can proudly state that all the hard work of
the Volvo Group’s employees to deliver the best products, services and
after-sales service generated results.
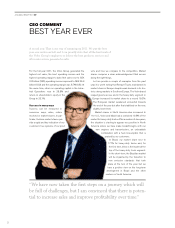
CEO COMMENT
BEST YEAR EVER
For the full-year 2011, the Volvo Group generated the
highest net sales, the best operating income and the
highest operating margin to date. Net sales rose to SEK
310 billion (265), operating income improved to SEK 26.9
billion (18.0) and the operating margin was 8.7% (6.8). At
the same time, return on operating capital in the Indus-
trial Operations rose to 28.8% and
return on shareholders’ equity in the
Group to 23.1%.
Success in many ways
Success can be measured in
numerous ways; sales, orders
received or market shares. In par-
ticular, I believe market shares pro-
vide a rapid and key indication of our
customers’ true opinions of our prod-
“We have now taken the first steps on a journey which will
be full of challenges, but I am convinced that there is poten-
tial to increase sales and improve profitability over time.”
ucts and how we compare to the competition. Market
shares comprise a clear acknowledgement that we are
doing the right things.
Let me provide a couple of examples from the past
year. It is worth noting that Renault Trucks maintained its
market share in Europe despite weak demand in its his-
toric strong markets in Southern Europe. The Volvo brand
reaped great success and in the heavy-duty segment in
Europe increased its market share to a record 16.0%.
The European market weakened somewhat towards
the end of the year but after that stabilized on the new,
slightly lower level.
Market shares in North America also increased. In
the U.S., Volvo and Mack had a combined 19.8% of the
market for heavy-duty trucks. After a number of slow years,
the situation is starting to appear very positive in North
America where we have made breakthroughs with our
own engines and transmissions, an unbeatable
combination with a fuel-consumption that is
praised by our customers.
In Brazil, our market share rose to
17.1% for heavy-duty trucks and, for
the first time, Volvo is the leader at the
top of the heavy-duty truck segment.
In the short-term, the Brazilian market
will be impacted by the transition to
new emission standards that took
place at the turn of the year, but we
have a positive view on the long-term
development in Brazil and the other
markers in South America.
2