Volvo 2011 Annual Report Download - page 107
Download and view the complete annual report
Please find page 107 of the 2011 Volvo annual report below. You can navigate through the pages in the report by either clicking on the pages listed below, or by using the keyword search tool below to find specific information within the annual report.-
 1
1 -
2
-
3
-
4
-
5
-
6
-
7
-
8
-
9
-
10
-
11
-
12
-
13
-
14
-
15
-
16
-
17
-
18
-
19
-
20
-
21
-
22
-
23
-
24
-
25
-
26
-
27
-
28
-
29
-
30
-
31
-
32
-
33
-
34
-
35
-
36
-
37
-
38
-
39
-
40
-
41
-
42
-
43
-
44
-
45
-
46
-
47
-
48
-
49
-
50
-
51
-
52
-
53
-
54
-
55
-
56
-
57
-
58
-
59
-
60
-
61
-
62
-
63
-
64
-
65
-
66
-
67
-
68
-
69
-
70
-
71
-
72
-
73
-
74
-
75
-
76
-
77
-
78
-
79
-
80
-
81
-
82
-
83
-
84
-
85
-
86
-
87
-
88
-
89
-
90
-
91
-
92
-
93
-
94
-
95
-
96
-
 97
97 -
 98
98 -
 99
99 -
 100
100 -
 101
101 -
 102
102 -
 103
103 -
 104
104 -
 105
105 -
 106
106 -
 107
107 -
 108
108 -
 109
109 -
 110
110 -
 111
111 -
 112
112 -
 113
113 -
 114
114 -
 115
115 -
 116
116 -
 117
117 -
118
-
119
-
120
-
121
-
122
-
123
-
124
-
125
-
126
-
127
-
128
-
129
-
130
-
131
-
132
-
133
-
134
-
135
-
136
-
137
-
138
-
139
-
140
-
141
-
142
-
143
-
144
-
145
-
146
-
147
-
148
-
149
-
150
-
151
-
152
-
153
-
154
-
155
-
156
-
157
-
158
-
159
-
160
-
161
-
162
-
163
-
164
-
165
-
166
 |
 |
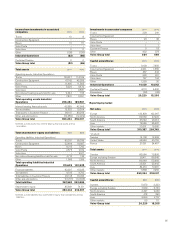
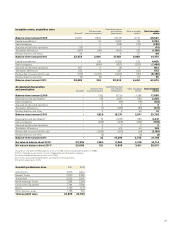
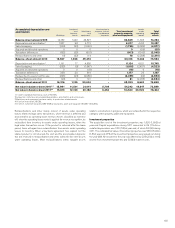
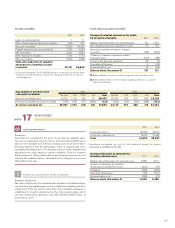
Reclassifications and other mainly consist of assets under operating
leases related to legal sales transactions, where revenue is deferred and
accounted for as operating lease revenue. Assets classified as inventory
will, when the operating lease model is applied for revenue recognition, be
reclassified from inventory to assets under operating leases, when the
legal sales transaction occurs. If the product is returned after the lease
period, there will again be a reclassification from assets under operating
leases to inventory. When a buy-back agreement has expired, but the
related product is not returned, the cost and the accumulated deprecia-
tion are reversed in reclassification and other, within the line item assets
under operating leases. Most reclassifications within tangible assets
relate to construction in progress, which are reclassified to the respective
category within property, plant and equipment.
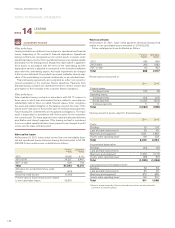
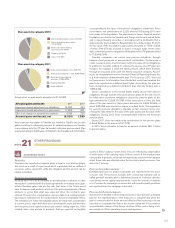
Investment properties
The acquisition cost of the investment properties was 1,625 (1,692) at
year-end. Capital expenditures during 2011 amounted to 39 (11). Accu-
mulated depreciation was 742 (744) at year-end, of which 53 (55) during
2011. The estimated fair value of investment properties was SEK 2.5 billion
(1.8) at year-end. 91% of the investment properties were leased out during
the year (89). Net income for the year was affected by 235 (223) in rental
income from investment properties and 53 (63) in direct costs.
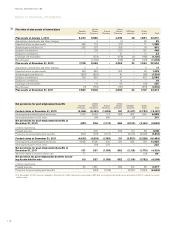
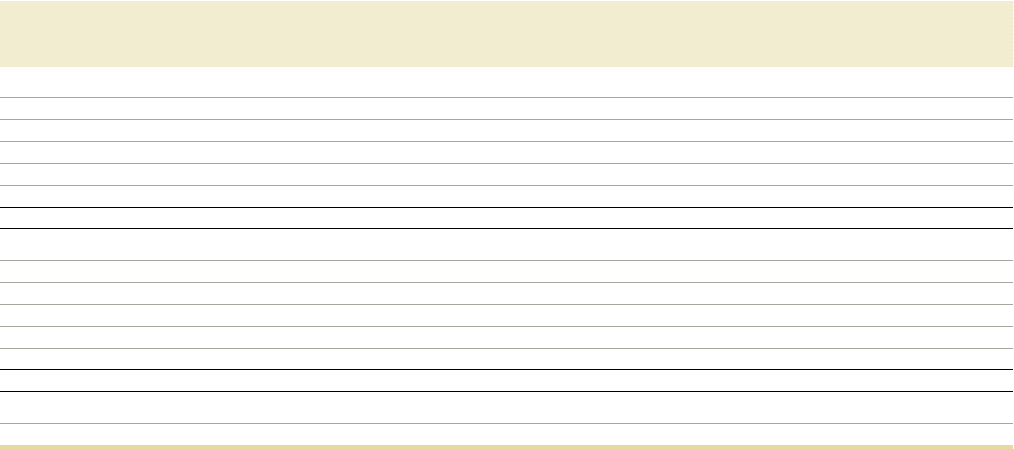
Accumulated depreciation and
amortization
Buildings
Land and
land
improve-
ments
Machinery
and
equipment3
Construction in
progress, includ-
ing advance
payments
Total investment
property, property,
plant and equipment
Assets
under
operating
leases
Total
tangible
assets
Balance-sheet amount 2009 14,780 1,042 46,827 – 62,649 11,605 74,254
Depreciation and amortization41,207 98 4,772 – 6,077 4,410 10,487
Sales/scrapping (224) (22) (1,549) – (1,795) (3,082) (4,877)
Acquired and divested operations 0 0 0 – 0(55) (55)
Translation differences (192) (20) (691) – (903) (1,142) (2,045)
Reclassifications and other (4) (32) 114 – 78 (2,288) (2,210)
Balance–sheet amount 2010 15,567 1,066 49,473 – 66,106 9,448 75,554
Depreciation and amortization41,191 77 4,856 – 6,124 4,621 10,745
Sales/scrapping (260) (9) (1,647) – (1,916) (2,407) (4,323)
Acquired and divested operations 0 0 (18) – (18) 0(18)
Translation differences 338 20 819 – 1,177 20 1,197
Reclassified to assets held for sale (496) (23) (2,980) – (3,499) (94) (3,593)
Reclassifications and other (24) 4 101 – 81 (2,945) (2,864)
Balance–sheet amount 2011 16,316 1,135 50,604 – 68,055 8,643 76,698
Net value in balance sheet 20102, 5 15,991 11,501 21,041 5,709 54,242 19,647 73,889
Net value in balance sheet 20112, 5 15,813 12,123 20,152 6,452 54,540 23,922 78,462
1 Includes capitalized borrowing costs of 83 (67).
2 Acquisition costs less accumulated depreciation, amortization and write-downs.
3 Machinery and equipment pertains mainly to production related assets.
4 Of which write-down 28 (26).
5 Of which, investment property 883 (948) and property, plant and equipment 53,657 (153,294).
103