Volvo 2011 Annual Report Download - page 71
Download and view the complete annual report
Please find page 71 of the 2011 Volvo annual report below. You can navigate through the pages in the report by either clicking on the pages listed below, or by using the keyword search tool below to find specific information within the annual report.-
 1
1 -
2
-
3
-
4
-
5
-
6
-
7
-
8
-
9
-
10
-
11
-
12
-
13
-
14
-
15
-
16
-
17
-
18
-
19
-
20
-
21
-
22
-
23
-
24
-
25
-
26
-
27
-
28
-
29
-
30
-
31
-
32
-
33
-
34
-
35
-
36
-
37
-
38
-
39
-
40
-
41
-
42
-
43
-
44
-
45
-
46
-
47
-
48
-
49
-
50
-
51
-
52
-
53
-
54
-
55
-
56
-
57
-
58
-
59
-
60
-
 61
61 -
 62
62 -
 63
63 -
 64
64 -
 65
65 -
 66
66 -
 67
67 -
 68
68 -
 69
69 -
 70
70 -
 71
71 -
 72
72 -
 73
73 -
 74
74 -
 75
75 -
 76
76 -
 77
77 -
 78
78 -
 79
79 -
 80
80 -
 81
81 -
82
-
83
-
84
-
85
-
86
-
87
-
88
-
89
-
90
-
91
-
92
-
93
-
94
-
95
-
96
-
97
-
98
-
99
-
100
-
101
-
102
-
103
-
104
-
105
-
106
-
107
-
108
-
109
-
110
-
111
-
112
-
113
-
114
-
115
-
116
-
117
-
118
-
119
-
120
-
121
-
122
-
123
-
124
-
125
-
126
-
127
-
128
-
129
-
130
-
131
-
132
-
133
-
134
-
135
-
136
-
137
-
138
-
139
-
140
-
141
-
142
-
143
-
144
-
145
-
146
-
147
-
148
-
149
-
150
-
151
-
152
-
153
-
154
-
155
-
156
-
157
-
158
-
159
-
160
-
161
-
162
-
163
-
164
-
165
-
166
 |
 |

IMPORTANT
AN
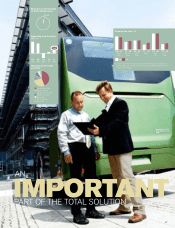
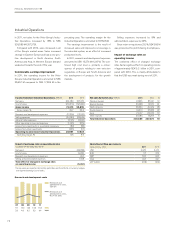
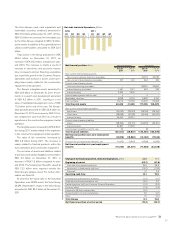
Operating income (loss)
SEK M
11
942
10
167
09
(680)
08
1,397
07
1,649
3% (3)
Net sales as percentage
of Volvo Group sales
Penetration rate1, %
2729
Volvo
Trucks
Renault
Trucks
Mack
Trucks
Buses Volvo
CE
UD
Trucks
1917 2020 1511 3535 1412
10 11
1 Share of unit sales financed by Volvo Financial Services in relation to
total number units sold by the Volvo Group in markets where financial
services are offered.
Distribution of credit
portfolio
Volvo Trucks 44%
Volvo CE 27%
Renault Trucks 12%
Mack Trucks 8%
Buses 5%
UD Trucks 3%
Other 1%
942
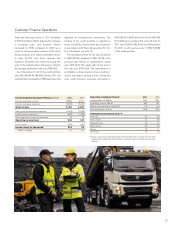
PART OF THE TOTAL SOLUTION
67