Volvo 2011 Annual Report Download - page 78
Download and view the complete annual report
Please find page 78 of the 2011 Volvo annual report below. You can navigate through the pages in the report by either clicking on the pages listed below, or by using the keyword search tool below to find specific information within the annual report.-
 1
1 -
2
-
3
-
4
-
5
-
6
-
7
-
8
-
9
-
10
-
11
-
12
-
13
-
14
-
15
-
16
-
17
-
18
-
19
-
20
-
21
-
22
-
23
-
24
-
25
-
26
-
27
-
28
-
29
-
30
-
31
-
32
-
33
-
34
-
35
-
36
-
37
-
38
-
39
-
40
-
41
-
42
-
43
-
44
-
45
-
46
-
47
-
48
-
49
-
50
-
51
-
52
-
53
-
54
-
55
-
56
-
57
-
58
-
59
-
60
-
61
-
62
-
63
-
64
-
65
-
66
-
67
-
 68
68 -
 69
69 -
 70
70 -
 71
71 -
 72
72 -
 73
73 -
 74
74 -
 75
75 -
 76
76 -
 77
77 -
 78
78 -
 79
79 -
 80
80 -
 81
81 -
 82
82 -
 83
83 -
 84
84 -
 85
85 -
 86
86 -
 87
87 -
 88
88 -
89
-
90
-
91
-
92
-
93
-
94
-
95
-
96
-
97
-
98
-
99
-
100
-
101
-
102
-
103
-
104
-
105
-
106
-
107
-
108
-
109
-
110
-
111
-
112
-
113
-
114
-
115
-
116
-
117
-
118
-
119
-
120
-
121
-
122
-
123
-
124
-
125
-
126
-
127
-
128
-
129
-
130
-
131
-
132
-
133
-
134
-
135
-
136
-
137
-
138
-
139
-
140
-
141
-
142
-
143
-
144
-
145
-
146
-
147
-
148
-
149
-
150
-
151
-
152
-
153
-
154
-
155
-
156
-
157
-
158
-
159
-
160
-
161
-
162
-
163
-
164
-
165
-
166
 |
 |

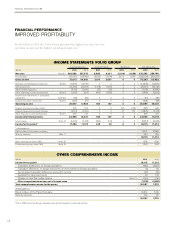
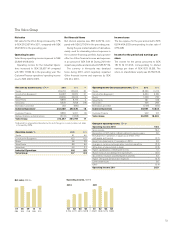
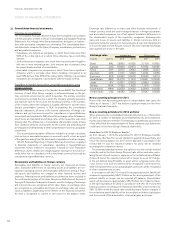
In 2011, net sales for the Volvo Group’s Indus-
trial Operations increased by 18% to SEK
303,589 M (257,375).
Compared with 2010, sales increased in all
of the Group’s market areas. Sales increased
strongly in Eastern Europe and had a very pos-
itive development in North America, South
America and Asia. In Western Europe demand
weakened towards the end of the year.
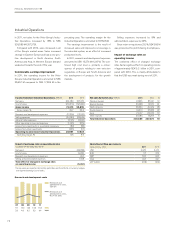
Considerable earnings improvement
In 2011, the operating income for the Volvo
Group’s Industrial Operations amounted to SEK
25,957 M compared to SEK 17,834 M in the
preceding year. The operating margin for the
Industrial Operations amounted to 8.6% (6.9).
The earnings improvement is the result of
increased sales and improved cost coverage in
the industrial system, as an effect of increased
production levels.
In 2011, research and development expenses
amounted to SEK 13,276 M (12,970). The con-
tinued high cost level is primarily a conse-
quence of projects relating to new emission
regulations in Europe and South America and
the development of products for the growth
markets.
Selling expenses increased by 8% and
administration expenses by 26%.
Since return on equity was 23,1%, SEK 550 M
was provisioned for profit-sharing to employees.
Impact of exchange rates on
operating income
The combined effect of changed exchange
rates had a negative effect on operating income
of approximately SEK 5.2 billion in 2011, com-
pared with 2010. This is mainly attributable to
that the USD was weak during most of 2011.
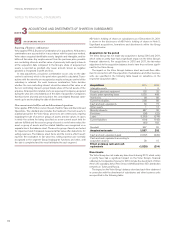
Income Statement Industrial Operations, SEK M 2011 2010
Net sales 303,589 257,375
Cost of sales (231,516) (197,480)
Gross income 72,073 59,895
Gross margin, % 23.7 23.3
Research and development expenses (13,276) (12,970)
Selling expenses (24,383) (22,649)
Administrative expenses (7,105) (5,640)
Other operating income and expenses (1,045) (659)
Income from investments in associated companies (82) (86)
Income from other investments (225) (57)
Operating income (loss) Industrial Operations 25,957 17,834
Operating margin, % 8.6 6.9
Impact of exchange rates on operating income
Compared with preceding year, SEK M
Net sales1(20,286)
Cost of sales 13.280
Research and development expenses 397
Selling and administrative expenses 1.408
Total effect of changes in exchange rates
on operating income (5.201)
1 Group sales are reported at monthly spot rates and the effects of currency hedges
are reported among Cost of sales.
Operating net flow per currency
Local currency, million 2011 2010
USD 3,970 2,410
EUR 57 373
GBP 555 405
CAD 397 241
JPY (x100) (218) (103)
Net sales by market area, SEK M 2011 2010 %
Western Europe 97,925 87,241 12
Eastern Europe 20,298 12,570 61
North America 58,253 45,409 28
South America 34,013 27,876 22
Asia 73,017 65,072 12
Other markets 20,083 19,207 5
Total Industrial Operations 303,589 257,375 18
Research and development costs
1110090807
13.313.013.214.311.1
4.45.06.34.93.9
Research and
development costs,
SEK bn
Research and
development costs,
% of net sales
Industrial Operations
74
FINANCIAL INFORMATION 2011