Volvo 2011 Annual Report Download - page 110
Download and view the complete annual report
Please find page 110 of the 2011 Volvo annual report below. You can navigate through the pages in the report by either clicking on the pages listed below, or by using the keyword search tool below to find specific information within the annual report.-
 1
1 -
2
-
3
-
4
-
5
-
6
-
7
-
8
-
9
-
10
-
11
-
12
-
13
-
14
-
15
-
16
-
17
-
18
-
19
-
20
-
21
-
22
-
23
-
24
-
25
-
26
-
27
-
28
-
29
-
30
-
31
-
32
-
33
-
34
-
35
-
36
-
37
-
38
-
39
-
40
-
41
-
42
-
43
-
44
-
45
-
46
-
47
-
48
-
49
-
50
-
51
-
52
-
53
-
54
-
55
-
56
-
57
-
58
-
59
-
60
-
61
-
62
-
63
-
64
-
65
-
66
-
67
-
68
-
69
-
70
-
71
-
72
-
73
-
74
-
75
-
76
-
77
-
78
-
79
-
80
-
81
-
82
-
83
-
84
-
85
-
86
-
87
-
88
-
89
-
90
-
91
-
92
-
93
-
94
-
95
-
96
-
97
-
98
-
99
-
 100
100 -
 101
101 -
 102
102 -
 103
103 -
 104
104 -
 105
105 -
 106
106 -
 107
107 -
 108
108 -
 109
109 -
 110
110 -
 111
111 -
 112
112 -
 113
113 -
 114
114 -
 115
115 -
 116
116 -
 117
117 -
 118
118 -
 119
119 -
 120
120 -
121
-
122
-
123
-
124
-
125
-
126
-
127
-
128
-
129
-
130
-
131
-
132
-
133
-
134
-
135
-
136
-
137
-
138
-
139
-
140
-
141
-
142
-
143
-
144
-
145
-
146
-
147
-
148
-
149
-
150
-
151
-
152
-
153
-
154
-
155
-
156
-
157
-
158
-
159
-
160
-
161
-
162
-
163
-
164
-
165
-
166
 |
 |

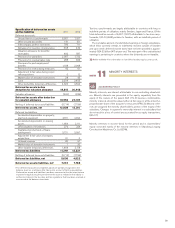
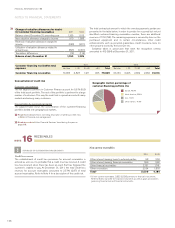
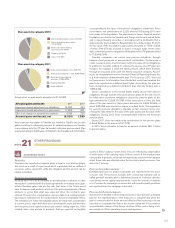
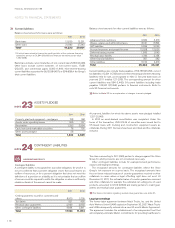
Europe, 45.9%
North America, 26.9%
Asia, 12.3%
Other markets, 14.9%
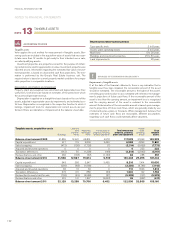
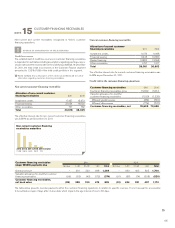
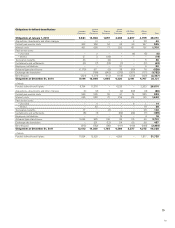
Customer financing receivables total
exposure
2011 2010
Not due 1–30 31–90 >90 Total Not due 1–30 31–90 >90 Total
Customer financing receivables 70,085 6,828 1,971 965 79,849 63,153 6,425 2,369 2,066 74,013
Concentration of credit risk
Customer concentration
The ten largest customers in Customer Finance account for 5.6 % (5.8)
of the total asset portfolio. The rest of the portfolio is pertinent to a large
number of customers. This way the credit risk is spread across both many
markets and among many customers.
Concentration by geographical market
The adjacent table shows the concentration of the customer-financing
portfolio divided into geographical markets.
Read more about Volvo’s overriding description of all Group credit risks
in Note 4, Financial-risk management.
Read more about Volvo Financial Services’ trend during the year on
page 66.
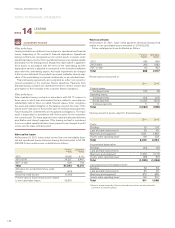
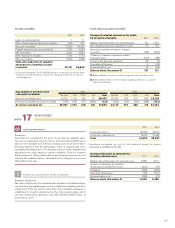
RECEIVABLES
16
NOTE
Credit loss reserves
The establishment of credit loss provisions for account receivables is
entered as soon as it is probable that a credit loss has incurred. A credit
loss has incurrent when there has been an event that has triggered the
customer’s inability to pay. At December 31, 2011, the total credit loss
reserves for account receivables amounted to 2.57% (2.87) of total
account receivables. Refer to Note 4 for a description of the credit risk.
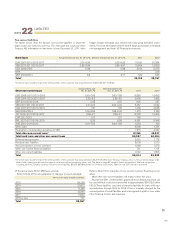
Non-current receivables
2011 2010
Other interest-bearingloans to external parties 98 204
Other interest-bearing financial receivables 596 562
Other financial receivables 2,131 1,741
Other receivables 2,184 1,676
Total15,009 4,184
1 Of non-current receivables, 2,822 (2,528) pertains to financial instruments.
Refer to Notes 4 and 30 for financial instruments as well as goals and policies
governing financial risk and financial instruments.
SOURCES OF ESTIMATION UNCERTAINTY
!
Geographic market, percentage of
customer-financing portfolio (%).
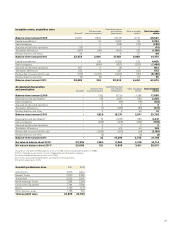
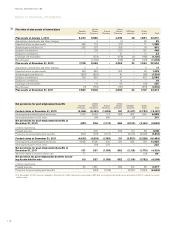
Change of valuation allowances for doubt-
ful customer-financing receivables 2011 2010
Balance sheet, December 31, preceding year 1,325 1,513
New valuation allowance charged to income 910 1,586
Reversal of valuation allowance charged to
income (250) (207)
Utilization of valuation allowance related to
actual losses (821) (1,451)
Translation differences (14) (116)
Balance sheet, December 31 1,150 1,325
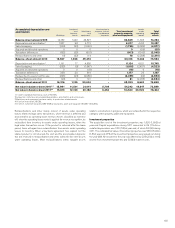
The total contractual amount to which the overdue payments pertain are
presented in the table below. In order to provide for occurred but not yet
identified customer-financing receivables overdue, there are additional
reserves of 776 (795). The remaining exposure is secured by liens on the
purchased equipment, and, in certain circumstances, other credit
enhancements such as personal guarantees, credit insurance, liens on
other property owned by the borrower etc.
Collateral taken in possession that meet the recognition criteria
amounted to 412 (594) at December 31, 2011.
NOTES TO FINANCIAL STATEMENTS
FINANCIAL INFORMATION 2011
106