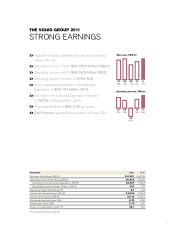
Volvo 2011 Annual Report Download - page 10
Download and view the complete annual report
Please find page 10 of the 2011 Volvo annual report below. You can navigate through the pages in the report by either clicking on the pages listed below, or by using the keyword search tool below to find specific information within the annual report.-
 1
1 -
 2
2 -
 3
3 -
 4
4 -
 5
5 -
 6
6 -
 7
7 -
 8
8 -
 9
9 -
 10
10 -
 11
11 -
 12
12 -
 13
13 -
 14
14 -
 15
15 -
 16
16 -
 17
17 -
 18
18 -
 19
19 -
 20
20 -
 21
21 -
22
-
23
-
24
-
25
-
26
-
27
-
28
-
29
-
30
-
31
-
32
-
33
-
34
-
35
-
36
-
37
-
38
-
39
-
40
-
41
-
42
-
43
-
44
-
45
-
46
-
47
-
48
-
49
-
50
-
51
-
52
-
53
-
54
-
55
-
56
-
57
-
58
-
59
-
60
-
61
-
62
-
63
-
64
-
65
-
66
-
67
-
68
-
69
-
70
-
71
-
72
-
73
-
74
-
75
-
76
-
77
-
78
-
79
-
80
-
81
-
82
-
83
-
84
-
85
-
86
-
87
-
88
-
89
-
90
-
91
-
92
-
93
-
94
-
95
-
96
-
97
-
98
-
99
-
100
-
101
-
102
-
103
-
104
-
105
-
106
-
107
-
108
-
109
-
110
-
111
-
112
-
113
-
114
-
115
-
116
-
117
-
118
-
119
-
120
-
121
-
122
-
123
-
124
-
125
-
126
-
127
-
128
-
129
-
130
-
131
-
132
-
133
-
134
-
135
-
136
-
137
-
138
-
139
-
140
-
141
-
142
-
143
-
144
-
145
-
146
-
147
-
148
-
149
-
150
-
151
-
152
-
153
-
154
-
155
-
156
-
157
-
158
-
159
-
160
-
161
-
162
-
163
-
164
-
165
-
166
 |
 |

A GLOBAL GROUP 2011 A GLOBAL GROUP 2011
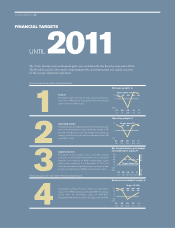
The Volvo Group’s previous financial goals were established by the Board in September 2006.
The Board focused on three goals comprising growth, operating margin and capital structure
for the Group’s Industrial Operations.
Growth
The growth target was that net sales should increase by a
minimum of 10% annually. During 2007–2011, the average
growth rate was 2.1% annually.
Operating margin
The Volvo Group’s profitability target was that operating margin
for the Industrial operations was to exceed an average of 7%
annually over a business cycle. The average annual operating
margin for the Volvo Group’s Industrial Operations was 4.1%
from 2007 to 2011.
Capital structure
The capital structure target is set to a net debt including
provisions for post-employment benefits for the Industrial
operations of a maximum of 40% of shareholders’ equity
under normal conditions. As of December 31, 2011, the
Volvo Group’s Industrial operations had a net financial debt
position corresponding to 25.2% of shareholders’ equity.
The target for Customer Finance is a return on shareholders’
equity of 12–15% and an equity ratio above 8%. The average
annual return on shareholders’ equity for 2007–2011
amounted to 6%. At year end 2011 the equity ratio was 9.1%.
1
2
3
4
FINANCIAL TARGETS
21
10
18
11
10
07
(
30)
0
6
08
(
28)
09
10
Target: above 10%
Net sales growth, %
6.9
10
8.6
11
7.8
07
0
5.2
08
(
7.8)
09
10
(
10)
Target: above 7%
Operating margin, %
37.4
10
25.2
11
5.7
07
0
(
20)
(
40)
39.7
08
70.9
09
40
20
80
60
Net cash Net debt
Target: below 40%
Net financial debt as percentage
of shareholders’ equity, %
0.4
10
7.3
11
15.9
07
(
10)
0
12.6
08
(
6.2)
09
15
10
5
(
5)
Target: 12–15%
Return on shareholders’ equity, %
Financial goals for Industrial Operations
Financial goals for Customer Finance Operations
UNTIL 2011
6