Volvo 2011 Annual Report Download - page 61
Download and view the complete annual report
Please find page 61 of the 2011 Volvo annual report below. You can navigate through the pages in the report by either clicking on the pages listed below, or by using the keyword search tool below to find specific information within the annual report.-
 1
1 -
2
-
3
-
4
-
5
-
6
-
7
-
8
-
9
-
10
-
11
-
12
-
13
-
14
-
15
-
16
-
17
-
18
-
19
-
20
-
21
-
22
-
23
-
24
-
25
-
26
-
27
-
28
-
29
-
30
-
31
-
32
-
33
-
34
-
35
-
36
-
37
-
38
-
39
-
40
-
41
-
42
-
43
-
44
-
45
-
46
-
47
-
48
-
49
-
50
-
 51
51 -
 52
52 -
 53
53 -
 54
54 -
 55
55 -
 56
56 -
 57
57 -
 58
58 -
 59
59 -
 60
60 -
 61
61 -
 62
62 -
 63
63 -
 64
64 -
 65
65 -
 66
66 -
 67
67 -
 68
68 -
 69
69 -
 70
70 -
 71
71 -
72
-
73
-
74
-
75
-
76
-
77
-
78
-
79
-
80
-
81
-
82
-
83
-
84
-
85
-
86
-
87
-
88
-
89
-
90
-
91
-
92
-
93
-
94
-
95
-
96
-
97
-
98
-
99
-
100
-
101
-
102
-
103
-
104
-
105
-
106
-
107
-
108
-
109
-
110
-
111
-
112
-
113
-
114
-
115
-
116
-
117
-
118
-
119
-
120
-
121
-
122
-
123
-
124
-
125
-
126
-
127
-
128
-
129
-
130
-
131
-
132
-
133
-
134
-
135
-
136
-
137
-
138
-
139
-
140
-
141
-
142
-
143
-
144
-
145
-
146
-
147
-
148
-
149
-
150
-
151
-
152
-
153
-
154
-
155
-
156
-
157
-
158
-
159
-
160
-
161
-
162
-
163
-
164
-
165
-
166
 |
 |

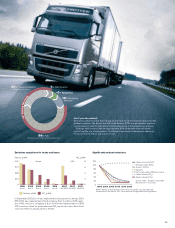
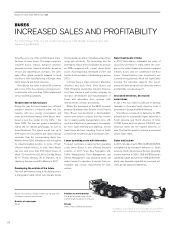
INCREASED
11101110
10.310.216.014.2
Volvo Renault
Market shares in Europe,
heavy-duty trucks
11101110
6.8
7.411.48.8
Mack Volvo
Market shares in North America,
heavy-duty trucks
20.122.2
UD
1110
Market shares in Japan,
heavy-duty trucks
11101110
10.810.94.85.2
Volvo Renault
Market shares in Europe,
medium-duty trucks
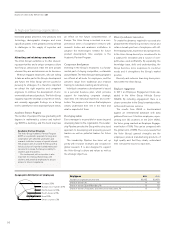
57
Operating income (loss)
and operating margin
SEK M
%
11
18,260
9.1
10
10,112
6.0
09
(10,805)
(7.8)
08
12,167
6.0
07
15,193
8.1
64% (63)
Net sales as percentage
of Volvo Group’s sales
Net sales SEK bn
11
200.7
10
167.3
09
138.9
08
203.6
07
187.9
Net sales by market
SEK M 2011 2010
Europe 85,173 69,606
North America 37,120 26,901
South America 26,822 21,680
Asia 37,551 35,231
Other markets 14,037 13,888
Total 200,703 167,305
Deliveries by market
Number of trucks 2011 2010
Europe 95,113 65,503
North America 42,613 24,282
South America 29,274 21,483
Asia 56,165 53,833
Other markets 15,226 14,888
Total 238,391 179,989
200.7
18,260
SALES IN ALL MARKETS