Volvo 2011 Annual Report Download - page 152
Download and view the complete annual report
Please find page 152 of the 2011 Volvo annual report below. You can navigate through the pages in the report by either clicking on the pages listed below, or by using the keyword search tool below to find specific information within the annual report.-
 1
1 -
2
-
3
-
4
-
5
-
6
-
7
-
8
-
9
-
10
-
11
-
12
-
13
-
14
-
15
-
16
-
17
-
18
-
19
-
20
-
21
-
22
-
23
-
24
-
25
-
26
-
27
-
28
-
29
-
30
-
31
-
32
-
33
-
34
-
35
-
36
-
37
-
38
-
39
-
40
-
41
-
42
-
43
-
44
-
45
-
46
-
47
-
48
-
49
-
50
-
51
-
52
-
53
-
54
-
55
-
56
-
57
-
58
-
59
-
60
-
61
-
62
-
63
-
64
-
65
-
66
-
67
-
68
-
69
-
70
-
71
-
72
-
73
-
74
-
75
-
76
-
77
-
78
-
79
-
80
-
81
-
82
-
83
-
84
-
85
-
86
-
87
-
88
-
89
-
90
-
91
-
92
-
93
-
94
-
95
-
96
-
97
-
98
-
99
-
100
-
101
-
102
-
103
-
104
-
105
-
106
-
107
-
108
-
109
-
110
-
111
-
112
-
113
-
114
-
115
-
116
-
117
-
118
-
119
-
120
-
121
-
122
-
123
-
124
-
125
-
126
-
127
-
128
-
129
-
130
-
131
-
132
-
133
-
134
-
135
-
136
-
137
-
138
-
139
-
140
-
141
-
 142
142 -
 143
143 -
 144
144 -
 145
145 -
 146
146 -
 147
147 -
 148
148 -
 149
149 -
 150
150 -
 151
151 -
 152
152 -
 153
153 -
 154
154 -
 155
155 -
 156
156 -
 157
157 -
 158
158 -
 159
159 -
 160
160 -
 161
161 -
 162
162 -
163
-
164
-
165
-
166
 |
 |

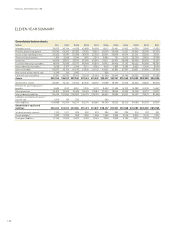
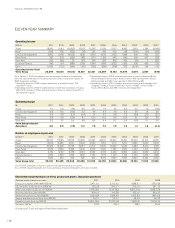
ELEVEN-YEAR SUMMARY
Operating income
SEK M 2011 2010 2009 2008 2007 200612005 20042200332002 20014
Trucks 18,260 10,112 (10,805) 12,167 15,193 13,116 11,717 8,992 3,951 1,189 (2,066)
Buses 1,036 780 (350) (76) 231 745 470 158 (790) (94) (916)
Construction Equipment 6,653 6,180 (4,005) 1,808 4,218 4,072 2,752 1,898 908 406 527
Volvo Penta 781 578 (230) 928 1,173 1,105 943 940 695 647 658
Volvo Aero 336 286 50 359 529 359 836 403 (44) 5 653
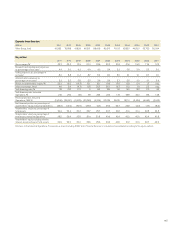
Customer Finance 942 167 (680) 1,397 1,649 1,686 2,033 1,365 926 490 325
Other (1,109) (102) (994) (731) (762) (684) (598) 923 (3,142) 194 143
Operating income (loss)
Volvo Group 26,899 18,000 (17,013) 15,851 22,231 20,399 18,153 14,679 2,504 2,837 (676)
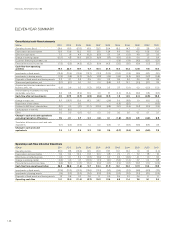
Operating margin
% 2011 2010 2009 2008 2007 2006 2005 2004 2003 2002 2001
Trucks 9.1 6.0 (7.8) 6.0 8.1 7.7 7.5 6.6 3.4 1.0 (1.8)
Construction Equipment 10.2 11.5 (11.2) 3.2 7.9 9.7 7.9 6.5 3.9 1.9 2.5
Buses 4.6 3.8 (1.9) (0.4) 1.4 4.3 2.8 1.2 (6.6) (0.7) (5.5)
Volvo Penta 8.8 6.6 (2.8) 8.1 10.0 10.3 9.6 10.4 9.1 8.4 8.9
Volvo Aero 5.2 3.7 0.6 4.8 6.9 4.4 11.1 5.8 (0.5) 0.1 5.5
Volvo Group Industrial
Operations 8.6 6.9 (7.8) 5.2 7.8 7.9 7.9 7.3 1.4 1.6 (0.4)
Number of employees at year-end
Number1, 2 2011 2010 2009 2008 2007 2006 2005 2004 2003 2002 2001
Trucks 62,315 57,796 56,505 64,280 64,390 49,900 50,240 49,450 46,900 43,470 44,180
Buses 8,529 8,685 9,541 8,930 9,290 7,760 7,710 7,700 6,680 6,660 6,230
Construction Equipment 18,422 16,648 16,126 19,810 19,710 11,050 10,290 9,930 9,280 8,410 7,780
Volvo Penta 2,549 2,353 2,928 2,940 3,000 1,650 1,560 1,580 1,440 1,410 1,370
Volvo Aero 3,179 3,120 3,278 3,510 3,550 3,510 3,460 3,350 3,440 3,660 4,040
Financial Services 1,323 1,235 1,234 1,290 1,150 1,010 1,070 1,100 1,060 1,060 1,080
Other 1,845 572 596 620 610 8,310 7,530 7,970 6,940 6,490 6,240
Volvo Group, total 98,162 90,409 90,208 101,380 101,700 83,190 81,860 81,080 75,740 71,160 70,920
As of January 1, 2007, the benefits from the synergies created in the business
units are transferred back to the various business areas. Comparison figures for
2006 have been restated.
1 Operating income in 2006 includes adjustment of goodwill of neg 1,712,
reported in Trucks.
2 Operating income in 2004 included reversal of write-down of shares in Scania
AB of 915, reported in Other, and write-down of shares in Henlys Group Plc of
95, reported in Buses.
3 Operating income in 2003 included write-down of shares in Scania AB and
Henlys Group Plc amounting to 4,030, of which 429 was reported in Buses
(Henlys Group) and 3,601 was reported in Other (Scania AB).
4 Operating income in 2001 included restructuring costs mainly related to the
integration of Mack Trucks and Renault Trucks of 3,862 of which 3,106 in
Trucks, 392 in Buses and 364 in Construction Equipment.
1 As of 2007, employees in business units are allocated to the business areas.
2 As of 2009 regular employees are shown, previously temporary employees were also included.
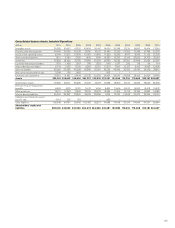
Environmental performance of Volvo production plants, Industrial operations
Absolute values related to net sales 2011 2010 2009 2008
Energy consumption (GWh; MWh/SEK M) 2,471; 8.1 2,315; 9.0 1,888; 9.1 2,530; 8.6
CO2 emissions (1,000 tons; tons/SEK M) 255; 0.8 279; 1.1 213; 1.0 291; 1.0
Water consumption (1,000 m3; m3/SEK M) 7,970; 26.2 7,519; 29.2 6,637; 31.8 8,205; 27.8
NOx emissions (tons; kilos/SEK M) 474; 1.6 719; 2.8 322; 1.5 800; 2.7
Solvent emissions (tons; kilos/SEK M) 2,554; 8.4 2,294; 8.9 1,435; 6.9 1,945; 6.6
Sulphur dioxide emissions (tons; kilos/SEK M) 34; 0.1 33; 0.1 38; 0.2 64; 0.2
Hazardous waste (tons; kg/SEK M) 25,943; 85.5 22,730; 88 17,558; 84 27,675; 94
Net sales, SEK bn 303.6 257.4 208.5 294.9
1 Excluding UD Trucks and Ingersoll Rand Road Development.
FINANCIAL INFORMATION 2011
148