Volvo 2011 Annual Report Download - page 65
Download and view the complete annual report
Please find page 65 of the 2011 Volvo annual report below. You can navigate through the pages in the report by either clicking on the pages listed below, or by using the keyword search tool below to find specific information within the annual report.-
 1
1 -
2
-
3
-
4
-
5
-
6
-
7
-
8
-
9
-
10
-
11
-
12
-
13
-
14
-
15
-
16
-
17
-
18
-
19
-
20
-
21
-
22
-
23
-
24
-
25
-
26
-
27
-
28
-
29
-
30
-
31
-
32
-
33
-
34
-
35
-
36
-
37
-
38
-
39
-
40
-
41
-
42
-
43
-
44
-
45
-
46
-
47
-
48
-
49
-
50
-
51
-
52
-
53
-
54
-
 55
55 -
 56
56 -
 57
57 -
 58
58 -
 59
59 -
 60
60 -
 61
61 -
 62
62 -
 63
63 -
 64
64 -
 65
65 -
 66
66 -
 67
67 -
 68
68 -
 69
69 -
 70
70 -
 71
71 -
 72
72 -
 73
73 -
 74
74 -
 75
75 -
76
-
77
-
78
-
79
-
80
-
81
-
82
-
83
-
84
-
85
-
86
-
87
-
88
-
89
-
90
-
91
-
92
-
93
-
94
-
95
-
96
-
97
-
98
-
99
-
100
-
101
-
102
-
103
-
104
-
105
-
106
-
107
-
108
-
109
-
110
-
111
-
112
-
113
-
114
-
115
-
116
-
117
-
118
-
119
-
120
-
121
-
122
-
123
-
124
-
125
-
126
-
127
-
128
-
129
-
130
-
131
-
132
-
133
-
134
-
135
-
136
-
137
-
138
-
139
-
140
-
141
-
142
-
143
-
144
-
145
-
146
-
147
-
148
-
149
-
150
-
151
-
152
-
153
-
154
-
155
-
156
-
157
-
158
-
159
-
160
-
161
-
162
-
163
-
164
-
165
-
166
 |
 |

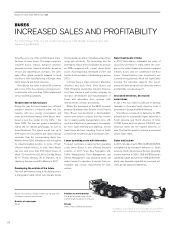
HYBRIDS
LEADER IN
Operating income (loss)
and operating margin
SEK M
%
11
1,036
4.6
10
780
3.8
09
(350)
(1.9)
08
(76)
(0.4)
07
231
1.4
7% (8)
Net sales as percentage
of Volvo Group sales
Net sales
SEK bn
11
22.3
10
20.5
09
18.5
08
17.3
07
16.6
22.3
1,036
Deliveries by market
Number of buses 2011 2010
Europe 2,695 2,395
North America 3,014 2,092
South America 2,620 1,174
Asia 3,417 3,477
Other markets 1,040 1,091
Total 12,786 10,229
Net sales by market
SEK M 2011 2010
Europe 7,009 6,242
North America 7,541 7,200
South America 2,721 1,737
Asia 3,027 3,299
Other markets 1,991 2,038
Total 22,289 20,516
61