Volvo 2011 Annual Report Download - page 77
Download and view the complete annual report
Please find page 77 of the 2011 Volvo annual report below. You can navigate through the pages in the report by either clicking on the pages listed below, or by using the keyword search tool below to find specific information within the annual report.-
 1
1 -
2
-
3
-
4
-
5
-
6
-
7
-
8
-
9
-
10
-
11
-
12
-
13
-
14
-
15
-
16
-
17
-
18
-
19
-
20
-
21
-
22
-
23
-
24
-
25
-
26
-
27
-
28
-
29
-
30
-
31
-
32
-
33
-
34
-
35
-
36
-
37
-
38
-
39
-
40
-
41
-
42
-
43
-
44
-
45
-
46
-
47
-
48
-
49
-
50
-
51
-
52
-
53
-
54
-
55
-
56
-
57
-
58
-
59
-
60
-
61
-
62
-
63
-
64
-
65
-
66
-
 67
67 -
 68
68 -
 69
69 -
 70
70 -
 71
71 -
 72
72 -
 73
73 -
 74
74 -
 75
75 -
 76
76 -
 77
77 -
 78
78 -
 79
79 -
 80
80 -
 81
81 -
 82
82 -
 83
83 -
 84
84 -
 85
85 -
 86
86 -
 87
87 -
88
-
89
-
90
-
91
-
92
-
93
-
94
-
95
-
96
-
97
-
98
-
99
-
100
-
101
-
102
-
103
-
104
-
105
-
106
-
107
-
108
-
109
-
110
-
111
-
112
-
113
-
114
-
115
-
116
-
117
-
118
-
119
-
120
-
121
-
122
-
123
-
124
-
125
-
126
-
127
-
128
-
129
-
130
-
131
-
132
-
133
-
134
-
135
-
136
-
137
-
138
-
139
-
140
-
141
-
142
-
143
-
144
-
145
-
146
-
147
-
148
-
149
-
150
-
151
-
152
-
153
-
154
-
155
-
156
-
157
-
158
-
159
-
160
-
161
-
162
-
163
-
164
-
165
-
166
 |
 |
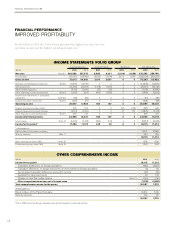
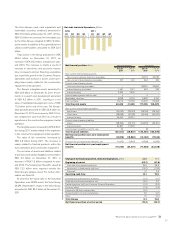
Net sales
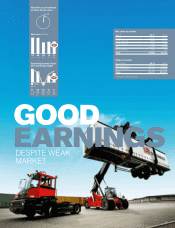
Net sales for the Volvo Group increased by 17%
to SEK 310,367 M in 2011, compared with SEK
264,749 M in the preceding year.
Operating income
Volvo Group operating income improved to SEK
26,899 M (18,000).
Operating income for the Industrial Opera-
tions increased to SEK 25,957 M compared
with SEK 17,834 M in the preceding year. The
Customer Finance operations’ operating income
rose to SEK 942 M (167).
Net financial items
Net interest expense was SEK 2,267 M, com-
pared with SEK 2,700 M in the preceding year.
During the year, market valuation of derivatives,
mainly used for eliminating interest exposure in
the customer financing portfolio, had a positive
effect on Other financial income and expenses
in an amount of SEK 544 M. During 2010 the
impact was positive and amounted to SEK 871 M.
The currency in Venezuela was devalued
twice during 2010, which negatively impacted
Other financial income and expenses by SEK
274 M in 2010.
Income taxes
The tax expense for the year amounted to SEK
6,814 M (4,302) corresponding to a tax rate of
27% (28).
Income for the period and earnings per
share
The income for the period amounted to SEK
18,115 M (11,212), corresponding to diluted
earnings per share of SEK 8.75 (5.36). The
return on shareholders’ equity was 23.1% (16.0).
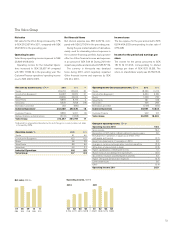
Net sales by business area, SEK M 2011 2010 %
Trucks 200,703 167,305 20
Construction Equipment 64,987 53,810 21
Buses 22,289 20,516 9
Volvo Penta 8,859 8,716 2
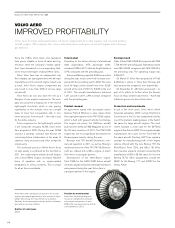
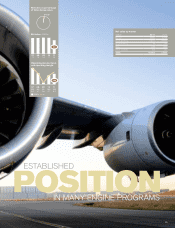
Volvo Aero 6,509 7,708 (16)
Eliminations and other 242 (680)
Industrial Operations1303,589 257,375 18
Customer Finance 8,883 9,031 (2)
Reclassifications and eliminations (2,104) (1,658)
Volvo Group 310,367 264,749 17
1 Adjusted for acquired and divested units and changes in currency rates, net sales
increased by 20%. Change in operating income, SEK bn
Operating income 2010 18.0
Gross income 19.4
Recognition of VAT credits in Brazil relating to previous years 0.6
Disturbances in operations in Japan as an effect of the
earthquake and tsunami (0.7)
Resultfrom divestments of companiesin 2010 0.2
Changes in currency exchange rates, Industrial operations (5.2)
Write-down of shares listed in Japan (0.2)
Higher capitalization of development costs 1.0
Higher research and development expenditures (2.0)
Tax credit for research and development activities 0.3
Higher selling and administrative expenses (4.7)
Lower credit losses 0.6
Other (0.4)
Operating income 2011 26.9
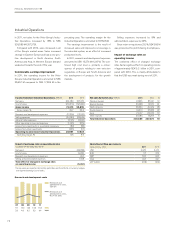
Operating income (loss) by business area, SEK M 2011 2010
Trucks 18,260 10,112
Construction Equipment 6,653 6,180
Buses 1,036 780
Volvo Penta 781 578
Volvo Aero 336 286
Eliminations and other (1,109) (102)
Industrial Operations 25,957 17,834
Customer Finance 942 167
Volvo Group 26,899 18,000
Operating margin, % 2011 2010
Trucks 9.1 6.0
Construction Equipment 10.2 11.5
Buses 4.6 3.8
Volvo Penta 8.8 6.6
Volvo Aero 5.2 3.7
Industrial Operations 8.6 6.9
Volvo Group 8.7 6.8
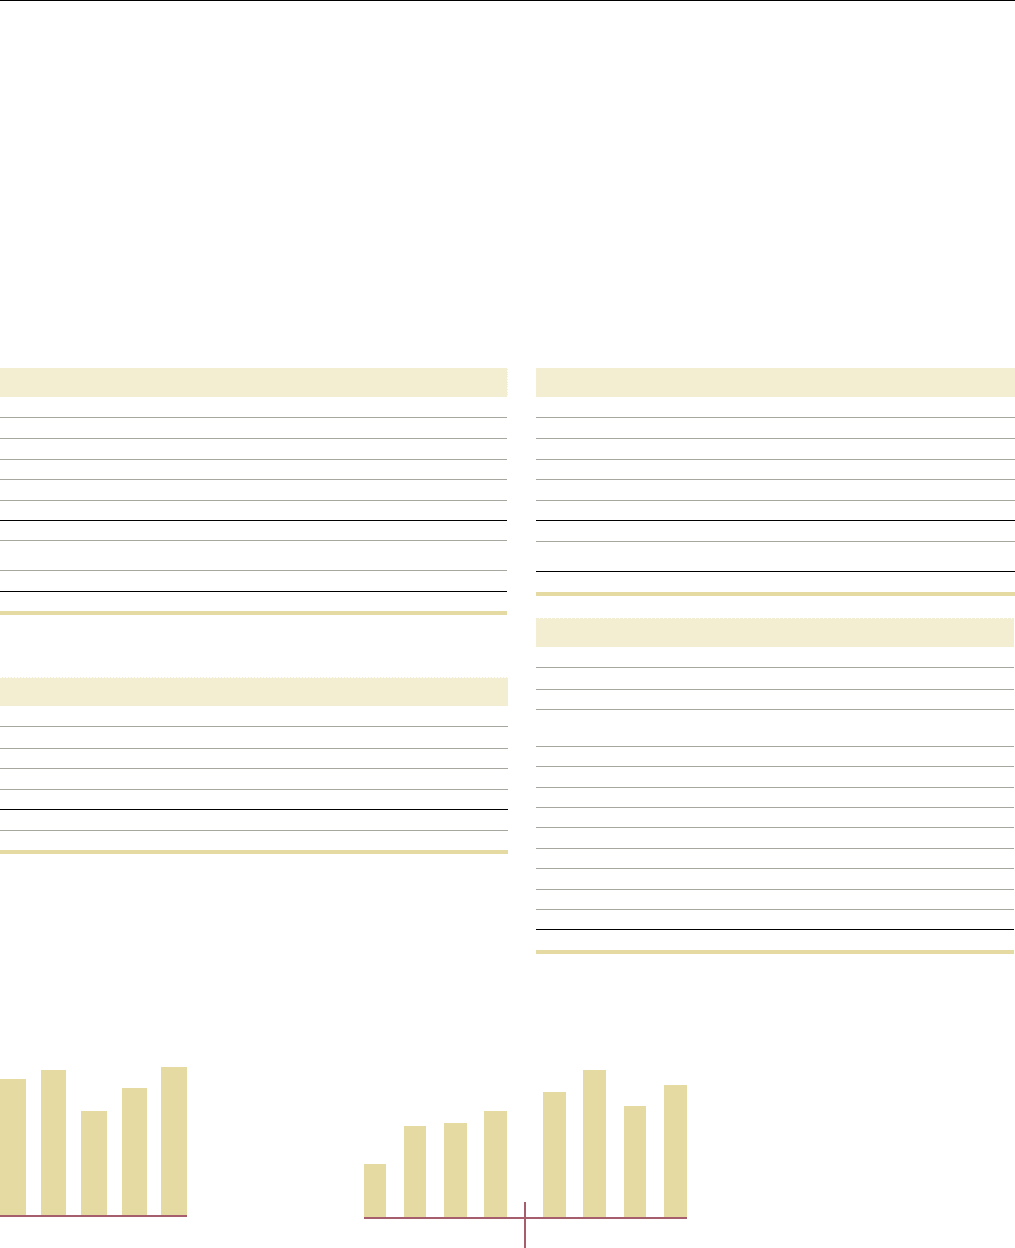
Net sales, SEK bn
11100908
265218304285
07
310
The Volvo Group
Operating income, SEK M
2010 2011
Q4
6,955
Q3
5,774
Q2
7,648
Q1
6,522
Q4
5,518
Q3
4,913
Q2
4,770
Q1
2,799
73