Volvo 2011 Annual Report Download - page 145
Download and view the complete annual report
Please find page 145 of the 2011 Volvo annual report below. You can navigate through the pages in the report by either clicking on the pages listed below, or by using the keyword search tool below to find specific information within the annual report.-
 1
1 -
2
-
3
-
4
-
5
-
6
-
7
-
8
-
9
-
10
-
11
-
12
-
13
-
14
-
15
-
16
-
17
-
18
-
19
-
20
-
21
-
22
-
23
-
24
-
25
-
26
-
27
-
28
-
29
-
30
-
31
-
32
-
33
-
34
-
35
-
36
-
37
-
38
-
39
-
40
-
41
-
42
-
43
-
44
-
45
-
46
-
47
-
48
-
49
-
50
-
51
-
52
-
53
-
54
-
55
-
56
-
57
-
58
-
59
-
60
-
61
-
62
-
63
-
64
-
65
-
66
-
67
-
68
-
69
-
70
-
71
-
72
-
73
-
74
-
75
-
76
-
77
-
78
-
79
-
80
-
81
-
82
-
83
-
84
-
85
-
86
-
87
-
88
-
89
-
90
-
91
-
92
-
93
-
94
-
95
-
96
-
97
-
98
-
99
-
100
-
101
-
102
-
103
-
104
-
105
-
106
-
107
-
108
-
109
-
110
-
111
-
112
-
113
-
114
-
115
-
116
-
117
-
118
-
119
-
120
-
121
-
122
-
123
-
124
-
125
-
126
-
127
-
128
-
129
-
130
-
131
-
132
-
133
-
134
-
 135
135 -
 136
136 -
 137
137 -
 138
138 -
 139
139 -
 140
140 -
 141
141 -
 142
142 -
 143
143 -
 144
144 -
 145
145 -
 146
146 -
 147
147 -
 148
148 -
 149
149 -
 150
150 -
 151
151 -
 152
152 -
 153
153 -
 154
154 -
 155
155 -
156
-
157
-
158
-
159
-
160
-
161
-
162
-
163
-
164
-
165
-
166
 |
 |

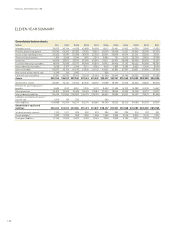
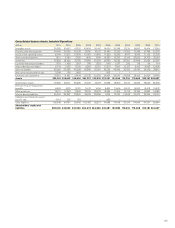
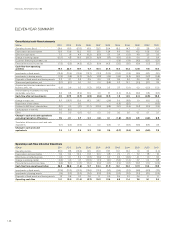
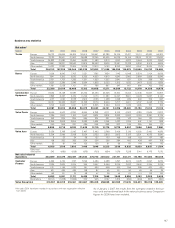
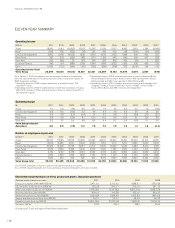
ELEVEN-YEAR SUMMARY
The eleven-year summary presents each year in accordance with the
Generally Accepted Accounting Practice (GAAP) for that year. Earlier
years are not restated when new accounting standards are applied. The
years 2001–2003 are accounted for in accordance with Swedish GAAP
for the respective year. As from 2004 the reporting is based on IFRS. The
transition to IFRS is described in Note 3 in the 2005 and 2006 Annual
Reports. As from January 1, 2007, the benefits from the synergies created
in the business units are transferred back to the product areas. Also, as
from January 1, 2007, the responsibility for the Group’s treasury operations
and real estate has been transferred from Volvo Financial Services, which,
as from January 1, 2007, only are consolidated in accordance with the
purchase method. Comparison figures for 2006 have been recalculated.
Consolidated income statements
SEK M 2011 2010 2009 2008 2007 2006 2005 2004 2003 2002 2001
Net sales 310,367 264,749 218,361 303,667 285,405 258,835 240,559 211,076 183,291 186,198 189,280
Cost of sales (235,104) (201,797) (186,167) (237,578) (219,600) (199,054) (186,662) (164,170) (146,879) (151,569) (155,592)
Gross income 75,263 62,952 32,194 66,089 65,805 59,781 53,897 46,906 36,412 34,629 33,688
Research and development
expenses (13,276) (12,970) (13,193) (14,348) (11,059) (8,354) (7,557) (7,614) (6,829) (5,869) (5,391)
Selling expenses (26,001) (24,149) (25,334) (27,129) (26,068) (21,213) (20,778) (19,369) (16,866) (16,604) (15,766)
Administrative expenses (7,132) (5,666) (5,863) (6,940) (7,133) (6,551) (6,301) (5,483) (5,467) (5,658) (6,709)
Other operating income and
expenses (1,649) (2,023) (4,798) (1,915) 163 (3,466) (588) (618) (1,367) (4,152) (4,096)
Income (loss) from investments
in associated companies (81) (86) (14) 25 430 61 (557) 27 200 182 50
Income from other investments (225) (58) (6) 69 93 141 37 830 (3,579) 309 1,410
Restructuring costs – – – – – – – – – – (3,862)
Operating income (loss) 26,899 18,000 (17,013) 15,851 22,231 20,399 18,153 14,679 2,504 2,837 (676)
Interest income and
similar credits 608 442 390 1,171 952 666 654 821 1,096 1,217 1,275
Interest expenses
and similar charges (2,875) (3,142) (3,559) (1,935) (1,122) (585) (972) (1,254) (1,888) (1,840) (2,274)
Other financial income
and expenses 297 213 (392) (1,077) (504) (181) 181 (1,210) (55) (201) (191)
Income (loss) after financial
items 24,929 15,514 (20,573) 14,010 21,557 20,299 18,016 13,036 1,657 2,013 (1,866)
Income taxes (6,814) (4,302) 5,889 (3,994) (6,529) (3,981) (4,908) (3,129) (1,334) (590) 326
Income (loss) for the period 18,115 11,212 (14,685) 10,016 15,028 16,318 13,108 9,907 323 1,423 (1,540)
Attributable to
Equity holders of the Parent
Company 17,751 10,866 (14,718) 9,942 14,932 16,268 13,054 9,867 298 1,393 (1,467)
Minority interest 364 346 33 74 96 50 54 40 25 30 (73)
18,115 11,212 (14,685) 10,016 15,028 16,318 13,108 9,907 323 1,423 (1,540)
Consolidated income statements Industrial Operations
SEK M 2011 2010 2009 2008 2007 2006 2005 2004 2003 2002 2001
Net sales 303,589 257,375 208,487 294,932 276,795 249,020 231,191 202,171 174,768 177,080 180,615
Cost of sales (231,516) (197,480) (179,578) (232,247) (214,160) (192,400) (180,823) (158,453) (141,256) (145,453) (149,477)
Gross income 72,073 59,895 28,909 62,685 62,635 56,620 50,368 43,718 33,512 31,627 31,138
Research and development
expenses (13,276) (12,970) (13,193) (14,348) (11,059) (8,354) (7,557) (7,614) (6,829) (5,869) (5,391)
Selling expenses (24,383) (22,649) (23,752) (25,597) (24,671) (19,999) (19,616) (18,317) (15,891) (15,393) (14,663)
Administrative expenses (7,105) (5,640) (5,838) (6,921) (7,092) (6,481) (6,147) (5,310) (5,259) (5,464) (6,474)
Other operating income and
expenses (1,045) (659) (2,432) (1,457) 249 (3,275) (397) 7 (540) (2,989) (3,071)
Income from Volvo Financial
Services – – – – – – 2,033 1,365 926 490 325
Income (loss) from investments
in associated companies (82) (86) (15) 23 428 61 (568) 2 166 126 (86)
Income from other investments (225) (57) (13) 69 93 141 37 828 (3,581) 309 1,408
Restructuring costs – – – – – – – – – – (3,862)
Operating income (loss) 25,957 17,834 (16,333) 14,454 20,583 18,713 18,153 14,679 2,504 2,837 (676)
141