Volvo 2011 Annual Report Download - page 151
Download and view the complete annual report
Please find page 151 of the 2011 Volvo annual report below. You can navigate through the pages in the report by either clicking on the pages listed below, or by using the keyword search tool below to find specific information within the annual report.-
 1
1 -
2
-
3
-
4
-
5
-
6
-
7
-
8
-
9
-
10
-
11
-
12
-
13
-
14
-
15
-
16
-
17
-
18
-
19
-
20
-
21
-
22
-
23
-
24
-
25
-
26
-
27
-
28
-
29
-
30
-
31
-
32
-
33
-
34
-
35
-
36
-
37
-
38
-
39
-
40
-
41
-
42
-
43
-
44
-
45
-
46
-
47
-
48
-
49
-
50
-
51
-
52
-
53
-
54
-
55
-
56
-
57
-
58
-
59
-
60
-
61
-
62
-
63
-
64
-
65
-
66
-
67
-
68
-
69
-
70
-
71
-
72
-
73
-
74
-
75
-
76
-
77
-
78
-
79
-
80
-
81
-
82
-
83
-
84
-
85
-
86
-
87
-
88
-
89
-
90
-
91
-
92
-
93
-
94
-
95
-
96
-
97
-
98
-
99
-
100
-
101
-
102
-
103
-
104
-
105
-
106
-
107
-
108
-
109
-
110
-
111
-
112
-
113
-
114
-
115
-
116
-
117
-
118
-
119
-
120
-
121
-
122
-
123
-
124
-
125
-
126
-
127
-
128
-
129
-
130
-
131
-
132
-
133
-
134
-
135
-
136
-
137
-
138
-
139
-
140
-
 141
141 -
 142
142 -
 143
143 -
 144
144 -
 145
145 -
 146
146 -
 147
147 -
 148
148 -
 149
149 -
 150
150 -
 151
151 -
 152
152 -
 153
153 -
 154
154 -
 155
155 -
 156
156 -
 157
157 -
 158
158 -
 159
159 -
 160
160 -
 161
161 -
162
-
163
-
164
-
165
-
166
 |
 |

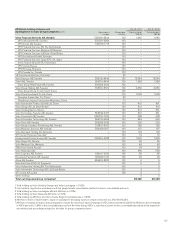
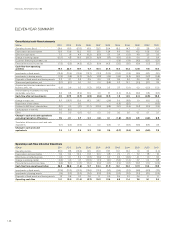
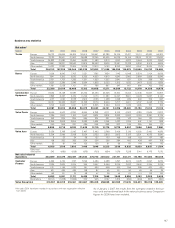
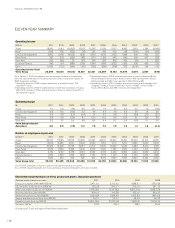
Business area statistics
Net sales1
SEK M 2011 2010 2009 2008 2007 2006 2005 2004 2003 2002 2001
Trucks Europe 85,173 69,606 65,874 109,914 108,651 93,282 79,706 77,431 70,101 67,830 66,367
North America 37,120 26,901 21,563 26,588 27,255 50,605 46,129 35,154 28,151 33,721 33,630
South America 26,822 21,680 12,490 14,680 11,483 9,213 7,657 5,223 3,464 3,277 3,993
Asia 37,551 35,231 26,943 37,515 26,593 8,975 13,551 12,378 9,206 5,919 4,659
Other markets 14,037 13,887 12,069 14,538 13,910 9,190 8,353 6,693 6,047 8,005 7,919
Total 200,703 167,305 138,940 203,235 187,892 171,265 155,396 136,879 116,969 118,752 116,568
Buses Europe 7,009 6,242 7,707 7,321 7,767 7,924 7,142 6,948 6,534 7,104 6,636
North America 7,541 7,200 5,673 5,355 4,630 4,910 4,247 2,960 2,984 3,838 6,847
South America 2,721 1,737 1,235 1,571 1,623 1,537 2,641 521 329 366 757
Asia 3,027 3,299 2,749 2,094 1,802 2,003 1,612 1,632 1,447 2,022 1,839
Other markets 1,991 2,038 1,101 971 786 897 947 661 684 705 596
Total 22,289 20,516 18,465 17,312 16,608 17,271 16,589 12,722 11,978 14,035 16,675
Construction Europe 19,052 16,138 12,987 25,192 25,294 20,326 15,524 13,453 12,348 10,837 10,667
Equipment North America 7,862 6,267 5,475 10,159 11,170 11,280 10,337 8,601 5,428 5,667 6,145
South America 4,177 4,130 2,578 2,913 2,155 1,358 1,238 922 636 709 847
Asia 30,151 24,352 12,957 13,738 12,179 6,903 5,717 4,961 3,707 3,048 2,773
Other markets 3,745 2,923 1,661 4,077 2,835 2,264 2,000 1,423 1,035 751 703
Total 64,987 53,810 35,658 56,079 53,633 42,131 34,816 29,360 23,154 21,012 21,135
Volvo Penta Europe 4,546 4,507 4,390 6,554 6,798 6,111 5,102 4,907 4,189 3,945 3,827
North America 1,386 1,500 1,100 1,947 2,674 2,815 2,832 2,500 2,109 2,261 2,175
South America 342 335 284 364 274 221 208 142 146 127 213
Asia 2,245 2,008 2,054 2,082 1,624 1,359 1,427 1,324 947 1,141 988
Other markets 340 366 331 486 349 268 207 184 205 195 177
Total 8,859 8,716 8,159 11,433 11,719 10,774 9,776 9,057 7,596 7,669 7,380
Volvo Aero Europe 3,036 3,768 3,942 3,497 3,462 3,798 3,406 3,179 4,000 3,450 4,875
North America 3,304 3,599 3,508 3,534 3,723 3,815 3,612 3,127 3,301 4,573 5,841
South America 8 27 34 58 127 173 168 138 152 177 187
Asia 108 233 205 234 234 356 284 400 428 497 708
Other markets 53 81 114 125 100 91 68 81 149 140 173
Total 6,509 7,708 7,803 7,448 7,646 8,233 7,538 6,925 8,030 8,837 11,784
Other and
eliminations 242 (680) (538) (575) (703) (654) 7,076 7,228 7,041 6,775 7,073
Net sales Industrial
Operations 303,589 257,375 208,487 294,932 276,795 249,020 231,191 202,171 174,768 177,080 180,615
Customer Europe 4,663 4,733 7,127 7,099 4,484 4,388 4,797 6,613 6,078 5,997 5,674
FinanceNorth America 2,326 2,605 3,004 369 2,467 2,569 2,036 2,432 2,542 3,344 3,216
South America 1,131 1,156 1,070 791 620 608 570 396 358 403 451
Asia 571 435 435 158 87 45 101 90 65 49 24
Other markets 192 101 75 68 47 38 45 67 110 132 130
Total 8,883 9,031 11,711 8,485 7,705 7,648 7,549 9,598 9,153 9,925 9,495
Eliminations (2,104) (1,658) (1,836) 250 905 2,167 1,819 (693) (630) (807) (830)
Volvo Group total 310,367 264,749 218,361 303,667 285,405 258,835 240,559 211,076 183,291 186,198 189,280
1 Net sales 2001 have been restated in accordance with new organization effective
from 2002. As of January 1, 2007, the results from the synergies created in the busi-
ness units are transferred back to the various business areas. Comparison
figures for 2006 have been restated.
147