Volvo 2011 Annual Report Download - page 149
Download and view the complete annual report
Please find page 149 of the 2011 Volvo annual report below. You can navigate through the pages in the report by either clicking on the pages listed below, or by using the keyword search tool below to find specific information within the annual report.-
 1
1 -
2
-
3
-
4
-
5
-
6
-
7
-
8
-
9
-
10
-
11
-
12
-
13
-
14
-
15
-
16
-
17
-
18
-
19
-
20
-
21
-
22
-
23
-
24
-
25
-
26
-
27
-
28
-
29
-
30
-
31
-
32
-
33
-
34
-
35
-
36
-
37
-
38
-
39
-
40
-
41
-
42
-
43
-
44
-
45
-
46
-
47
-
48
-
49
-
50
-
51
-
52
-
53
-
54
-
55
-
56
-
57
-
58
-
59
-
60
-
61
-
62
-
63
-
64
-
65
-
66
-
67
-
68
-
69
-
70
-
71
-
72
-
73
-
74
-
75
-
76
-
77
-
78
-
79
-
80
-
81
-
82
-
83
-
84
-
85
-
86
-
87
-
88
-
89
-
90
-
91
-
92
-
93
-
94
-
95
-
96
-
97
-
98
-
99
-
100
-
101
-
102
-
103
-
104
-
105
-
106
-
107
-
108
-
109
-
110
-
111
-
112
-
113
-
114
-
115
-
116
-
117
-
118
-
119
-
120
-
121
-
122
-
123
-
124
-
125
-
126
-
127
-
128
-
129
-
130
-
131
-
132
-
133
-
134
-
135
-
136
-
137
-
138
-
 139
139 -
 140
140 -
 141
141 -
 142
142 -
 143
143 -
 144
144 -
 145
145 -
 146
146 -
 147
147 -
 148
148 -
 149
149 -
 150
150 -
 151
151 -
 152
152 -
 153
153 -
 154
154 -
 155
155 -
 156
156 -
 157
157 -
 158
158 -
 159
159 -
160
-
161
-
162
-
163
-
164
-
165
-
166
 |
 |

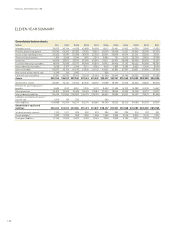
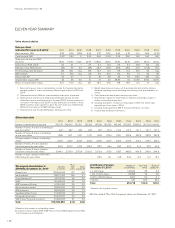
Key ratios
2011 2010 2009 2008 2007 2006 2005 2004 2003 2002 2001
Gross margin, %123.7 23.3 13.9 21.3 22.6 22.7 21.8 21.6 19.2 17.9 17.2
Research and development expenses
as percentage of net sales14.4 5.0 6.3 4.9 4.0 3.4 3.3 3.8 3.9 3.3 3.0
Selling expenses as percentage of
net sales18.0 8.8 11.4 8.7 8.9 8.0 8.5 9.1 9.1 8.7 8.1
Administration expenses as
percentage of net sales12.3 2.2 2.8 2.3 2.6 2.6 2.7 2.6 3.0 3.1 3.6
Return on shareholders' equity, % 23.1 16.0 (19.7) 12.1 18.1 19.6 17.8 13.9 0.4 1.7 neg
Interest coverage, times19.6 5.9 (4.7) 8.8 20.7 26.1 16.7 11.0 1.9 2.2 neg
Self-financing ratio, % 118 270 137 5 153 189 116 163 152 110 92
Self-financing ratio Industrial
Operations, % 210 294 (16) 78 265 235 173 268 243 196 148
Financial position, Industrial
Operations, SEK M (19,346) (24,691) (41,489) (29,795) (4,305) 23,076 18,675 18,110 (2,426) (6,063) (7,042)
Net financialposition as percentage of
shareholders' equity, Industrial Operations (25.2) (37.4) (70.9) (39.7) (5.7) 29.2 23.7 25.8 (3.3) (7.7) (8.2)
Shareholders’ equity as percentage of
total assets 24.3 23.3 20.2 22.7 25.7 33.7 30.6 31.3 31.4 32.8 32.8
Shareholders’ equity as percentage of
total assets, Industrial Operations 28.5 26.9 23.8 28.4 30.8 40.6 40.4 40.0 40.5 42.4 41.8
Shareholders’ equity excluding minority
interest as percentage of total assets 23.9 23.0 20.0 22.6 25.6 33.6 30.5 31.2 31.3 32.7 32.6
1 Pertains to the Industrial Operations. For periods up to and including 2006, Volvo Financial Services is included and consolidated according to the equity method.
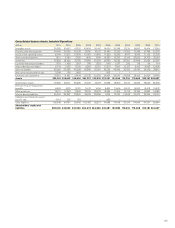
Exports from Sweden
SEK M 2011 2010 2009 2008 2007 2006 2005 2004 2003 2002 2001
Volvo Group, total 91,065 72,688 41,829 96,571 88,606 80,517 71,133 62,653 49,300 52,730 50,394
145