Volvo 2011 Annual Report Download - page 80
Download and view the complete annual report
Please find page 80 of the 2011 Volvo annual report below. You can navigate through the pages in the report by either clicking on the pages listed below, or by using the keyword search tool below to find specific information within the annual report.-
 1
1 -
2
-
3
-
4
-
5
-
6
-
7
-
8
-
9
-
10
-
11
-
12
-
13
-
14
-
15
-
16
-
17
-
18
-
19
-
20
-
21
-
22
-
23
-
24
-
25
-
26
-
27
-
28
-
29
-
30
-
31
-
32
-
33
-
34
-
35
-
36
-
37
-
38
-
39
-
40
-
41
-
42
-
43
-
44
-
45
-
46
-
47
-
48
-
49
-
50
-
51
-
52
-
53
-
54
-
55
-
56
-
57
-
58
-
59
-
60
-
61
-
62
-
63
-
64
-
65
-
66
-
67
-
68
-
69
-
 70
70 -
 71
71 -
 72
72 -
 73
73 -
 74
74 -
 75
75 -
 76
76 -
 77
77 -
 78
78 -
 79
79 -
 80
80 -
 81
81 -
 82
82 -
 83
83 -
 84
84 -
 85
85 -
 86
86 -
 87
87 -
 88
88 -
 89
89 -
 90
90 -
91
-
92
-
93
-
94
-
95
-
96
-
97
-
98
-
99
-
100
-
101
-
102
-
103
-
104
-
105
-
106
-
107
-
108
-
109
-
110
-
111
-
112
-
113
-
114
-
115
-
116
-
117
-
118
-
119
-
120
-
121
-
122
-
123
-
124
-
125
-
126
-
127
-
128
-
129
-
130
-
131
-
132
-
133
-
134
-
135
-
136
-
137
-
138
-
139
-
140
-
141
-
142
-
143
-
144
-
145
-
146
-
147
-
148
-
149
-
150
-
151
-
152
-
153
-
154
-
155
-
156
-
157
-
158
-
159
-
160
-
161
-
162
-
163
-
164
-
165
-
166
 |
 |
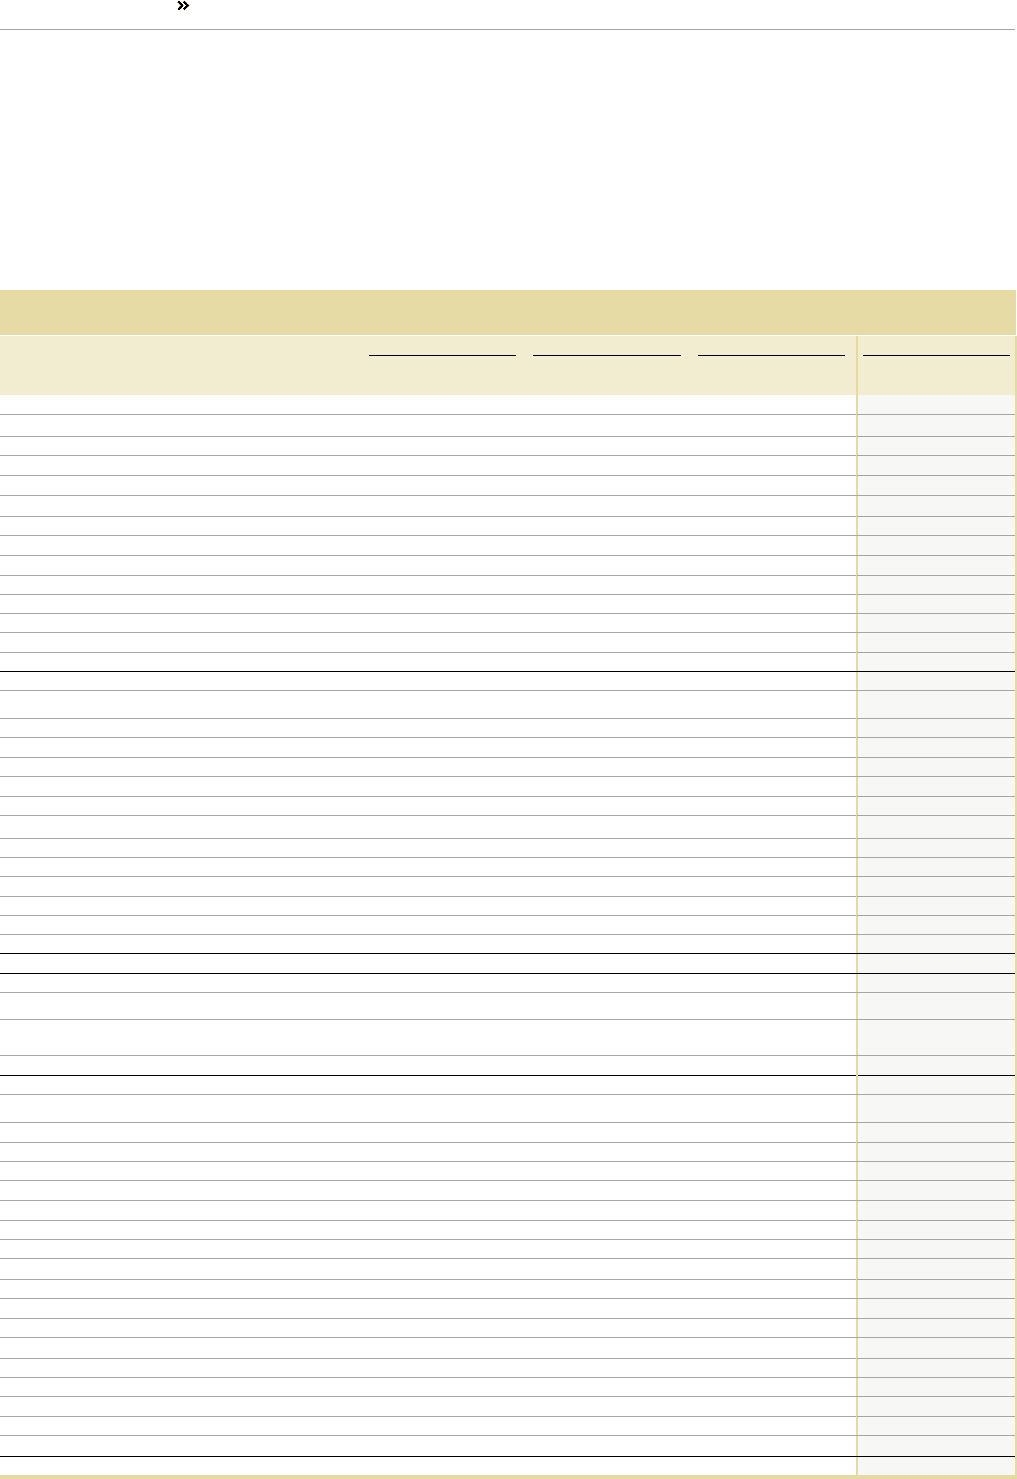
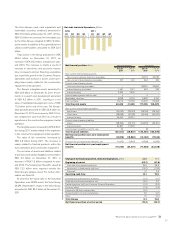
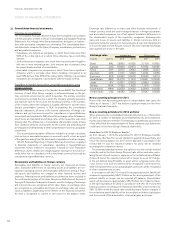
Net debt in the Volvo Group’s Industrial Operations amounted to SEK 19.3 billion at December 31, 2011,
equal to 25.2% of shareholders’ equity. Excluding provisions for post-employment benefits the Industrial
Operation’s net debt amounted to SEK 15.0 billion, which was equal to 19.5% of shareholders’ equity.
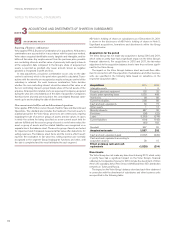
FINANCIAL POSITION
IMPROVED DURING THE YEAR
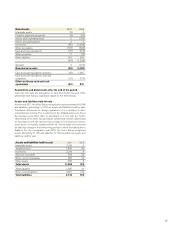
BALANCE SHEETS VOLVO GROUP
Industrial Operations Customer Finance Eliminations Volvo Group
SEK M
Dec 31
2011
Dec 31
2010
Dec 31
2011
Dec 31
2010
Dec 31
2011
Dec 31
2010
Dec 31
2011
Dec 31
2010
Assets
Non-current assets
Intangible assets Note 12 39,385 40,613 122 101 – – 39,507 40,714
Tangible assets Note 13
Property, plant and equipment 53,563 53,221 94 72 – – 53,657 53,294
Investment property 883 948 – – – – 883 948
Assets under operating leases 16,749 13,217 11,525 10,055 (4,352) (3,625) 23,922 19,647
Financial assets
Shares and participation Note 5 1,871 2,080 3 18 – – 1,874 2,098
Non-current customer-financing receivables Note 15 579 598 44,651 36,270 (4,612) (843) 40,618 36,025
Deferred tax assets Note 10 12,480 12,019 358 291 – – 12,838 12,310
Prepaid pensions Note 20 2,263 1,636 14 12 – – 2,277 1,648
Non-current interest-bearing receivables Note 16 757 941 – 204 (63) (379) 694 766
Other non-current receivables Note 16 4,500 3,401 50 41 (235) (24) 4,315 3,418
Total non-current assets 133,030 128,674 56,817 47,064 (9,262) (4,871) 180,585 170,868
Current assets
Inventories Note 17 43,828 38,956 771 882 – – 44,599 39,837
Current receivables
Customer-financing receivables Note 15 1,123 830 38,050 36,897 (1,092) (1,064) 38,081 36,663
Tax assets 1,152 1,045 48 90 – – 1,200 1,135
Interest-bearing receivables Note 16 1,461 1,071 226 1,283 (1,020) (2,012) 667 342
Internal funding1 2,253 7,505 – – (2,253) (7,505) – –
Accounts receivable Note 16 27,492 24,332 207 101 – – 27,699 24,433
Other receivables Note 16 13,438 11,561 1,411 1,352 (1,024) (1,056) 13,825 11,857
Non interest-bearing assets held for sale Note 3 9,344 136 – – – – 9,344 136
Interest-bearing assets held for sale Note 3 4 – – – – – 4 –
Marketable securities Note 18 6,838 9,735 24 32 – – 6,862 9,767
Cash and cash equivalents Note 18 29,113 21,756 1,593 1,545 (327) (335) 30,379 22,966
Total current assets 136,046 116,928 42,330 42,182 (5,717) (11,970) 172,659 147,139
Total assets 269,076 245,602 99,147 89,246 (14,979) (16,841) 353,244 318,007
Shareholders’ equity and liabilities Note 19
Equity attributable to the equity holder of the
Parent Company 75,582 65,090 8,999 8,020 – – 84,581 73,110
Minority interests 1,100 1,011 – – – – 1,100 1,011
Total shareholders’ equity 76,682 66,101 8,999 8,020 – – 85,681 74,121
Non-current provisions
Provisions for post-employment benefits Note 20 6,635 7,478 30 32 – – 6,665 7,510
Provisions for deferred taxes Note 10 4,171 3,026 1,465 1,496 – – 5,636 4,522
Other provisions Note 21 5,492 5,785 154 150 2 1 5,648 5,936
Non-current liabilities Note 22
Bond loans 38,192 38,767 – – – – 38,192 38,767
Other loans 38,848 37,180 8,974 8,225 (57) (78) 47,765 45,327
Internal funding1 (35,453) (26,971) 33,459 25,927 1,994 1,044 – –
Other liabilities 12,902 11,172 740 389 (3,195) (2,330) 10,447 9,231
Current provisions Note 21 9,438 8,429 92 105 1 1 9,531 8,534
Current liabilities Note 22
Loans 38,644 32,101 6,741 8,299 (863) (799) 44,522 39,601
Internal funding1 (24,837) (21,220) 35,373 33,643 (10,536) (12,423) – –
Non interest-bearing liabilities held for sale Note 3 4,710 135 – – – – 4,710 135
Interest-bearing liabilities held for sale Note 3 6 – – – – – 6 –
Trade payables 56,546 47,111 242 139 – – 56,788 47,250
Tax liabilities 2,220 1,571 171 161 – – 2,391 1,732
Other liabilities 34,880 34,937 2,707 2,660 (2,325) (2,257) 35,262 35,341
Total shareholders’ equity and liabilities 269,076 245,602 99,147 89,246 (14,979) (16,841) 353,244 318,007
1 Internal funding is internal lending from Industrial Operations to Customer Finance.
76
FINANCIAL INFORMATION 2011