Volvo 2011 Annual Report Download - page 146
Download and view the complete annual report
Please find page 146 of the 2011 Volvo annual report below. You can navigate through the pages in the report by either clicking on the pages listed below, or by using the keyword search tool below to find specific information within the annual report.-
 1
1 -
2
-
3
-
4
-
5
-
6
-
7
-
8
-
9
-
10
-
11
-
12
-
13
-
14
-
15
-
16
-
17
-
18
-
19
-
20
-
21
-
22
-
23
-
24
-
25
-
26
-
27
-
28
-
29
-
30
-
31
-
32
-
33
-
34
-
35
-
36
-
37
-
38
-
39
-
40
-
41
-
42
-
43
-
44
-
45
-
46
-
47
-
48
-
49
-
50
-
51
-
52
-
53
-
54
-
55
-
56
-
57
-
58
-
59
-
60
-
61
-
62
-
63
-
64
-
65
-
66
-
67
-
68
-
69
-
70
-
71
-
72
-
73
-
74
-
75
-
76
-
77
-
78
-
79
-
80
-
81
-
82
-
83
-
84
-
85
-
86
-
87
-
88
-
89
-
90
-
91
-
92
-
93
-
94
-
95
-
96
-
97
-
98
-
99
-
100
-
101
-
102
-
103
-
104
-
105
-
106
-
107
-
108
-
109
-
110
-
111
-
112
-
113
-
114
-
115
-
116
-
117
-
118
-
119
-
120
-
121
-
122
-
123
-
124
-
125
-
126
-
127
-
128
-
129
-
130
-
131
-
132
-
133
-
134
-
135
-
 136
136 -
 137
137 -
 138
138 -
 139
139 -
 140
140 -
 141
141 -
 142
142 -
 143
143 -
 144
144 -
 145
145 -
 146
146 -
 147
147 -
 148
148 -
 149
149 -
 150
150 -
 151
151 -
 152
152 -
 153
153 -
 154
154 -
 155
155 -
 156
156 -
157
-
158
-
159
-
160
-
161
-
162
-
163
-
164
-
165
-
166
 |
 |

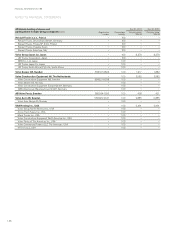
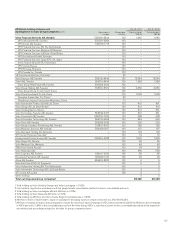
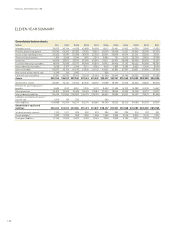
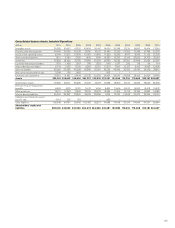
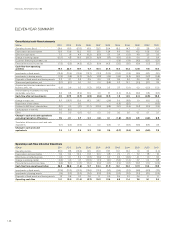
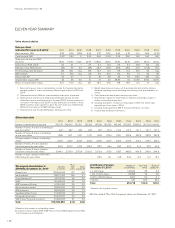
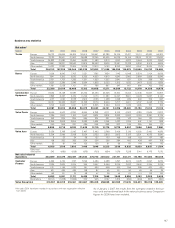
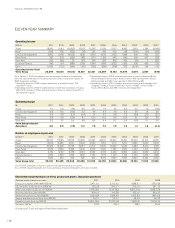
ELEVEN-YEAR SUMMARY
Consolidated balance sheets
SEK M 2011 2010 2009 2008 2007 2006 2005 2004 2003 2002 2001
Intangible assets 39,507 40,714 41,628 43,958 36,508 19,117 20,421 17,612 16,756 17,045 17,525
Property, plant and equipment 54,540 54,242 55,280 57,270 47,210 34,379 35,068 31,151 30,640 30,799 33,234
Assets under operating leases 23,922 19,647 20,388 25,429 22,502 20,501 20,839 19,534 21,201 23,525 27,101
Shares and participations 1,874 2,098 2,044 1,953 2,219 6,890 751 2,003 22,206 27,492 27,798
Inventories 44,599 39,837 37,727 55,045 43,645 34,211 33,937 28,598 26,459 28,305 31,075
Customer-financing receivables 78,699 72,688 81,977 98,489 78,847 64,742 64,466 51,193 46,002 46,998 48,784
Interest-bearing receivables 3,638 2,757 3,044 5,101 4,530 4,116 1,897 3,384 6,632 5,490 8,079
Other receivables 59,877 53,154 50,575 61,560 55,152 42,567 42,881 35,747 32,621 33,990 39,946
Non-current assets held for sale 9,348 136 1,692 – – 805 – – – – –
Cash and cash equivalents 37,241 32,733 37,910 23,614 31,034 31,099 36,947 34,746 28,735 25,578 27,383
Assets 353,244 318,007 332,265 372,419 321,647 258,427 257,207 223,968 231,252 239,222 260,925
Shareholders’ equity185,681 74,121 67,034 84,640 82,781 87,188 78,760 70,155 72,636 78,525 85,576
Provision for post-employment
benefits 6,665 7,510 8,051 11,705 9,774 8,692 11,986 14,703 15,288 16,236 14,647
Other provisions 20,815 18,992 19,485 29,076 27,084 20,970 18,556 14,993 15,048 16,721 18,427
Interest-bearing liabilities 130,479 123,695 156,852 145,727 108,318 66,957 74,885 61,807 74,092 72,437 81,568
Liabilities associated with assets
held for sale 4,716 135 272 – – 280 – – – – –
Other liabilities 104,888 93,554 80,571 101,271 93,690 74,340 73,020 62,310 54,188 55,303 60,707
Shareholders’ equity and
liabilities 353,244 318,007 332,265 372,419 321,647 258,427 257,207 223,968 231,252 239,222 260,925
1of which minority interests 1,100 1,011 629 630 579 284 260 229 216 247 391
Assets pledged 1,832 3,339 958 1,380 1,556 1,960 3,255 3,046 3,809 3,610 3,737
Contingent liabilities 17,154 11,003 9,607 9,427 8,153 7,726 7,850 9,189 9,611 9,334 10,441
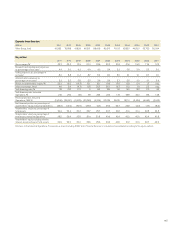
FINANCIAL INFORMATION 2011
142