Volvo 2011 Annual Report Download - page 84
Download and view the complete annual report
Please find page 84 of the 2011 Volvo annual report below. You can navigate through the pages in the report by either clicking on the pages listed below, or by using the keyword search tool below to find specific information within the annual report.-
 1
1 -
2
-
3
-
4
-
5
-
6
-
7
-
8
-
9
-
10
-
11
-
12
-
13
-
14
-
15
-
16
-
17
-
18
-
19
-
20
-
21
-
22
-
23
-
24
-
25
-
26
-
27
-
28
-
29
-
30
-
31
-
32
-
33
-
34
-
35
-
36
-
37
-
38
-
39
-
40
-
41
-
42
-
43
-
44
-
45
-
46
-
47
-
48
-
49
-
50
-
51
-
52
-
53
-
54
-
55
-
56
-
57
-
58
-
59
-
60
-
61
-
62
-
63
-
64
-
65
-
66
-
67
-
68
-
69
-
70
-
71
-
72
-
73
-
 74
74 -
 75
75 -
 76
76 -
 77
77 -
 78
78 -
 79
79 -
 80
80 -
 81
81 -
 82
82 -
 83
83 -
 84
84 -
 85
85 -
 86
86 -
 87
87 -
 88
88 -
 89
89 -
 90
90 -
 91
91 -
 92
92 -
 93
93 -
 94
94 -
95
-
96
-
97
-
98
-
99
-
100
-
101
-
102
-
103
-
104
-
105
-
106
-
107
-
108
-
109
-
110
-
111
-
112
-
113
-
114
-
115
-
116
-
117
-
118
-
119
-
120
-
121
-
122
-
123
-
124
-
125
-
126
-
127
-
128
-
129
-
130
-
131
-
132
-
133
-
134
-
135
-
136
-
137
-
138
-
139
-
140
-
141
-
142
-
143
-
144
-
145
-
146
-
147
-
148
-
149
-
150
-
151
-
152
-
153
-
154
-
155
-
156
-
157
-
158
-
159
-
160
-
161
-
162
-
163
-
164
-
165
-
166
 |
 |

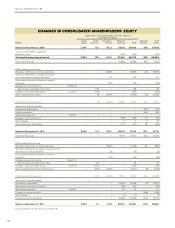
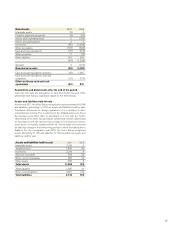
CHANGES IN CONSOLIDATED SHAREHOLDERS’ EQUITY
Shareholders’ equity attributable to equity holders of
the Parent Company
SEK M Share
capital Other
reserves1Translation
reserve Retained
earnings Total Minority
interests Total
equity
Balance at December 31, 2009 2,554 123 6,112 57,616 66,405 629 67,034
Transition effect IFRS 3, capitalized
transaction costs – – – (135) (135) – (135)
Total equity at beginning of period 2,554 123 6,112 57,481 66,270 629 66,899
Income for the period – – – 10,866 10,866 346 11,212
Other comprehensive income
Translation differences on foreign operations – – (3,859) – (3,859) (32) (3,891)
Translation differences on hedge instruments
of net investments in foreign operations – – 113 – 113 – 113
Accumulated translation differences reversed
to income – – (95) – (95) – (95)
Available-for-sale investments: Note 5, 19
Gains/losses at valuation to fair value – 148 – – 148 – 148
Change incash flow hedge reserve Note 19 – (156) – – (156) – (156)
Other comprehensive income – (8) (3,841) – (3,849) (32) (3,881)
Total income for the period – (8) (3,841) 10,866 7,017 314 7,331
Transactions with shareholders
Dividends to shareholders – – – – – (412) (412)
Capital contribution – – – – – 358 358
Share based payments Note 27 – – – – – – –
Changes in minority interests – – – (180) (180) 115 (65)
Other changes – – – 3 3 7 10
Transactions with shareholders – – – (177) (177) 68 (109)
Balance at December 31, 2010 2,554 115 2,271 68,170 73,110 1,011 74,121
Income for the period – – – 17,751 17,751 364 18,115
Other comprehensive income
Translation differences on foreign operations – – (1,062) – (1,062) 82 (980)
Translation differences on hedge instruments of net
investments in foreign operations – – (3) – (3) – (3)
Accumulated translation differences reversed
to income – – (30) – (30) – (30)
Available-for-sale investments: Note 5, 19
Gains/losses at valuation to fair value – 39 – – 39 – 39
Change in cash flow hedge reserve Note 19 – (144) – – (144) – (144)
Other comprehensive income for the period – (105) (1,095) – (1,200) 82 (1,118)
Total income for the period – (105) (1,095) 17,751 16,551 446 16,997
Transactions with shareholders
Dividends to shareholders – – – (5,069) (5,069) (2) (5,071)
Transactions with minority interests – – – (67) (67) – (67)
Share based payments Note 27 – – – 57 57 – 57
Changes in minority interests – – – – – (356) (356)
Other changes – – – (1) (1) 1 (0)
Transactions with shareholders – – – (5,080) (5,080) (357) (5,437)
Balance at December 31, 2011 2,554 10 1,176 80,841 84,581 1,100 85,681
1 For specification of other reserves, see Note 19.
FINANCIAL INFORMATION 2011
80