Volvo 2011 Annual Report Download - page 83
Download and view the complete annual report
Please find page 83 of the 2011 Volvo annual report below. You can navigate through the pages in the report by either clicking on the pages listed below, or by using the keyword search tool below to find specific information within the annual report.-
 1
1 -
2
-
3
-
4
-
5
-
6
-
7
-
8
-
9
-
10
-
11
-
12
-
13
-
14
-
15
-
16
-
17
-
18
-
19
-
20
-
21
-
22
-
23
-
24
-
25
-
26
-
27
-
28
-
29
-
30
-
31
-
32
-
33
-
34
-
35
-
36
-
37
-
38
-
39
-
40
-
41
-
42
-
43
-
44
-
45
-
46
-
47
-
48
-
49
-
50
-
51
-
52
-
53
-
54
-
55
-
56
-
57
-
58
-
59
-
60
-
61
-
62
-
63
-
64
-
65
-
66
-
67
-
68
-
69
-
70
-
71
-
72
-
 73
73 -
 74
74 -
 75
75 -
 76
76 -
 77
77 -
 78
78 -
 79
79 -
 80
80 -
 81
81 -
 82
82 -
 83
83 -
 84
84 -
 85
85 -
 86
86 -
 87
87 -
 88
88 -
 89
89 -
 90
90 -
 91
91 -
 92
92 -
 93
93 -
94
-
95
-
96
-
97
-
98
-
99
-
100
-
101
-
102
-
103
-
104
-
105
-
106
-
107
-
108
-
109
-
110
-
111
-
112
-
113
-
114
-
115
-
116
-
117
-
118
-
119
-
120
-
121
-
122
-
123
-
124
-
125
-
126
-
127
-
128
-
129
-
130
-
131
-
132
-
133
-
134
-
135
-
136
-
137
-
138
-
139
-
140
-
141
-
142
-
143
-
144
-
145
-
146
-
147
-
148
-
149
-
150
-
151
-
152
-
153
-
154
-
155
-
156
-
157
-
158
-
159
-
160
-
161
-
162
-
163
-
164
-
165
-
166
 |
 |

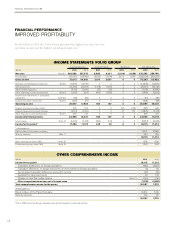
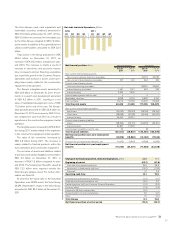
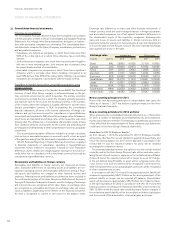
The cash flow within Industrial Operations was
positively affected by the operating income and
negatively affected by the increased working
capital. Accounts receivables and inventories
increased with SEK 3.1 and 7.1 billion respec-
tively, partly offset by the increase of trade pay-
ables of SEK 9.9 billion.
Financial items and paid income taxes had a
SEK 6.9 billion negative effect on cash flow
within Industrial Operations, mainly through
payments of interests and income tax.
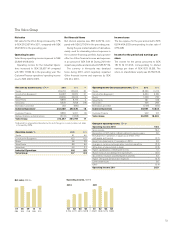
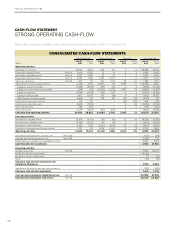
Operating cash flow within Customer Finance
was a negative SEK 14.1 billion (pos: SEK 1.4
billion), mainly due to increased customer
financing-receivables.
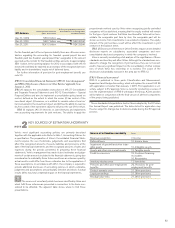
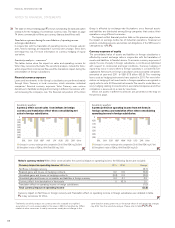
Investments
The Industrial Operations’ investments in fixed
assets and capitalized R&D during 2011
amounted to SEK 12.6 billion (10.3).
Capital expenditures in Trucks amounted to
SEK 8.4 billion (7.2). The capital expenditures
within Trucks consist to a large extent of invest-
ments related to product renewals in our product
program, with product development activities
and required adaptations in the plants. In the
plants there are also ongoing investments aim-
ing for increased capacity and flexibility, mainly
in the cab plant in Umeå, Sweden, and in the
engine plants with machining and assembly
processes in Skövde, Sweden, and Ageo,
Japan. During 2011 we have also invested in
the dealer network and workshops, mainly in
Europe and Asia, as well as in our joint venture
VE Commercial Vehicles (VECV).
Capital investments for Construction Equip-
ment amounted to SEK 1.9 billion (1.4). As for
Capital expenditures, Industrial Operations
11100908
3.22.62.12.1
4.05.04.33.6
7.17.710.58.0
Capitalized development
costs, SEK bn
Capital expenditures,
% of net sales
Property, plant and
equipment, SEK bn
07
4.1
4.1
8.5
Self-financing ratio,
Industrial Operations %
Cash-flow from operating activities
divided by net investments in fixed
assets and leasing assets.
1110090807
210294(16)78265
Operating cash flow,
Industrial Operations, SEK bn
2010 2011
Q4
10.7
Q3
2.2
Q2
5.2
Q1
(4.0)
Q4
15.1
Q3
(1.9)
Q2
8.5
Q1
(2.7)
previous year, the majority of the investments
refer to expansion of the excavator business for
both Volvo brand and SDLG brand. During 2011
mainly China and Korea have been impacted, in
capacity investments in machining and assem-
bly area. Product related investments during
the year refer to the emission regulations in
Europe and North America, and Tier 2 and Tier
3 requirements for new models in the BRIC
countries.
The investments within Volvo Aero was during
2011 SEK 0.5 billion (0.8). The majority of the
investments refer to the involvement in the new
engine programs, PW1100G and PW1000G
with Pratt & Whitney, and Trent XWB with Rolls-
Royce. The investments also refer to finalization
of a number of investments in Volvo Aero’s pro-
duction facilities in order to secure the capacity
required for the XWB and GP7000 program
(P&W), and rationalizations in the spool shop.
The investments in Buses were SEK 0.3 billion
(0.2), and in Volvo Penta SEK 0.2 billion (0.2).
Investments in leasing assets amounted to
SEK 1.4 billion (0.3), the increase versus previ-
ous year refers mainly to expansion of the rental
fleet as well as replacement of existing fleet.
For 2012, the Volvo Group estimates that
investments in property, plant and equipment
will be around SEK 10 billion. The investment
level is however pending the market develop-
ment, and in order to be able to adapt the level,
the ongoing and future investments are contin-
uously reviewed and prioritized. The invest-
ments in coming product programs continue
during 2012, as well as the expansion of the
business in the BRIC countries.
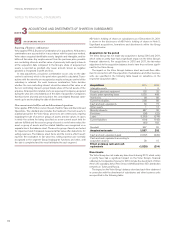
Acquisitions and divestments
Acquired and divested operations 2011 had a
negative impact on cash flow of SEK 1.6 billion
(positive 0.6).
Acquired operations refer mainly to several
minor acquisitions of assets and liabilities in
construction equipment rental operations. The
remaining minority interest in Volvo Aero Norge
and UD Trucks South Africa has also been
acquired during the year.
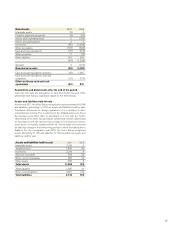
Financing and dividend
Net borrowings increased cash and cash equiv-
alents by SEK 8.7 billion during 2011.
During the year dividend of SEK 5.1 billion,
corresponding to SEK 2.50 per share, was paid
to the shareholders of AB Volvo.
Change in cash and cash equivalents
The Group’s cash and cash equivalents
increased by SEK 7.4 billion during the year and
amounted to SEK 30.4 billion at December 31,
2011.
Refer to Note 29 for principles for preparing
the cash flow analysis.
79