Volvo 2011 Annual Report Download - page 148
Download and view the complete annual report
Please find page 148 of the 2011 Volvo annual report below. You can navigate through the pages in the report by either clicking on the pages listed below, or by using the keyword search tool below to find specific information within the annual report.-
 1
1 -
2
-
3
-
4
-
5
-
6
-
7
-
8
-
9
-
10
-
11
-
12
-
13
-
14
-
15
-
16
-
17
-
18
-
19
-
20
-
21
-
22
-
23
-
24
-
25
-
26
-
27
-
28
-
29
-
30
-
31
-
32
-
33
-
34
-
35
-
36
-
37
-
38
-
39
-
40
-
41
-
42
-
43
-
44
-
45
-
46
-
47
-
48
-
49
-
50
-
51
-
52
-
53
-
54
-
55
-
56
-
57
-
58
-
59
-
60
-
61
-
62
-
63
-
64
-
65
-
66
-
67
-
68
-
69
-
70
-
71
-
72
-
73
-
74
-
75
-
76
-
77
-
78
-
79
-
80
-
81
-
82
-
83
-
84
-
85
-
86
-
87
-
88
-
89
-
90
-
91
-
92
-
93
-
94
-
95
-
96
-
97
-
98
-
99
-
100
-
101
-
102
-
103
-
104
-
105
-
106
-
107
-
108
-
109
-
110
-
111
-
112
-
113
-
114
-
115
-
116
-
117
-
118
-
119
-
120
-
121
-
122
-
123
-
124
-
125
-
126
-
127
-
128
-
129
-
130
-
131
-
132
-
133
-
134
-
135
-
136
-
137
-
 138
138 -
 139
139 -
 140
140 -
 141
141 -
 142
142 -
 143
143 -
 144
144 -
 145
145 -
 146
146 -
 147
147 -
 148
148 -
 149
149 -
 150
150 -
 151
151 -
 152
152 -
 153
153 -
 154
154 -
 155
155 -
 156
156 -
 157
157 -
 158
158 -
159
-
160
-
161
-
162
-
163
-
164
-
165
-
166
 |
 |
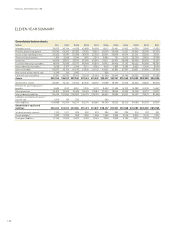
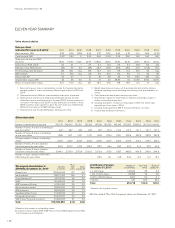
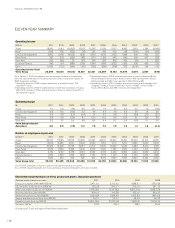
ELEVEN-YEAR SUMMARY
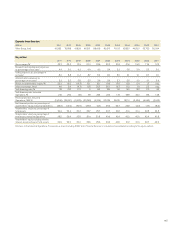
Consolidated cash-flow statements
SEK bn 2011 2010 2009 2008 2007 2006 2005 2004 2003 2002 2001
Operating income (loss) 26.9 18.0 (17.0) 15.9 22.2 20.4 18.2 14.7 2.5 2.8 (0.7)
Depreciation and amortization 13.9 13.8 15.2 13.5 12.5 12.4 9.9 10.0 10.2 10.8 10.0
Other non-cash items 1.3 1.6 4.4 (0.2) (0.5) 0.7 0.4 (0.1) 4.9 2.0 0.5
Change in working capital (15.1) 4.8 16.9 (23.3) (9.9) (7.7) (4.7) (1.4) 0.4 1.0 6.4
Customer financing receivables, net – – – – – – (7.8) (7.4) (4.3) (5.7) (3.7)
Financial items and income tax (7.3) (5.5) (4.6) (5.2) (5.9) (4.3) (2.0) (0.5) (0.9) (1.3) (2.1)
Cash-flow from operating
activities 19.7 32.7 14.9 0.7 18.4 21.5 14.0 15.3 12.8 9.6 10.4
Investments in fixed assets (12.6) (10.4) (10.5) (12.7) (10.1) (10.0) (10.3) (7.4) (6.0) (6.7) (8.1)
Investments in leasing assets (7.4) (4.8) (4.2) (5.4) (4.8) (4.6) (4.5) (4.4) (5.3) (5.2) (5.8)
Disposals of fixed assets and leasing assets 3.3 3.1 3.8 2.9 2.9 3.2 2.6 2.4 2.9 3.2 2.6
Shares and participations, net (0.1) (0.1) 0.0 0.0 0.4 (5.8) 0.3 15.1 (0.1) (0.1) 3.9
Acquired and divested subsidiaries and other
business units, net (1.6) 0.6 0.2 (1.3) (15.0) 0.5 0.7 (0.1) 0.0 (0.2) 13.0
Interest-bearing receivables including
marketable securities 2.6 6.8 (8.9) 10.9 3.6 7.7 (1.3) (6.4) (2.0) (1.5) (3.7)
Cash-flow after net investments 3.9 27.9 (4.7) (4.9) (4.6) 12.5 1.5 14.5 2.3 (0.9) 12.3
Changein loans, net 8.7 (25.7) 12.6 18.2 28.7 (2.6) 3.6 (8.8) 1.9 (0.1) 6.2
Repurchase of own shares - – 0.0 – – – (1.8) (2.5) – – (8.3)
Dividend to AB Volvo’s shareholders (5.1) 0.0 (4.1) (11.1) (20.3) (6.8) (5.1) (3.4) (3.4) (3.4) (3.4)
Cash payment to minority 0.0 (0.1) – – – – – – – – –
Other 0.0 0.0 (0.1) 0.0 0.0 0.0 0.0 0.0 0.1 0.1 0.1
Change in cash and cash equivalents
excluding translation differences 7.5 2.1 3.7 2.2 3.8 3.1 (1.8) (0.2) 0.9 (4.3) 6.9
Translation differences on cash and cash
equivalents (0.1) (0.4) (0.2) 1.0 0.0 (0.5) 1.1 (0.2) (0.6) (0.7) 0.6
Change in cash and cash
equivalents 7.4 1.7 3.5 3.2 3.8 2.6 (0.7) (0.4) 0.3 (5.0) 7.5
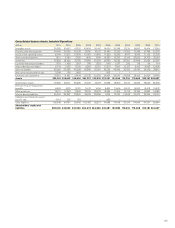
Operating cash-flow Industrial Operations
SEK bn 2011 2010 2009 2008 2007 2006 2005 2004 2003 2002 2001
Operating income 26.0 17.8 (16.3) 14.5 20.6 18.7 16.1 13.3 1.6 2.3 (1.0)
Depreciation and amortization 11.4 11.4 12.4 11.8 10.3 9.8 7.3 7.1 7.2 7.8 7.0
Other items not affecting cash 0.6 0.1 2.3 (0.7) (0.4) 0.2 0.2 (0.6) 4.1 1.0 0.0
Change in working capital (4.2) 4.6 4.7 (10.9) (0.1) (3.1) (5.6) (1.4) 0.7 0.4 6.8
Financial items and income taxes (6.9) (5.1) (4.7) (5.0) (6.0) (3.7) (1.9) (0.2) (0.7) (1.1) (2.3)
Cash-flow from operating activities 26.9 28.8 (1.6) 9.7 24.4 21.9 16.1 18.2 12.9 10.4 10.5
Investments in fixed assets (12.6) (10.3) (10.3) (12.6) (10.1) (9.7) (9.9) (7.2) (5.8) (6.3) (7.7)
Investments in leasing assets (1.4) (0.3) (0.2) (0.4) (0.2) (0.5) (0.3) (0.3) (0.1) (0.1) (0.5)
Disposals of fixed assets and leasing assets 1.2 0.8 0.7 0.6 1.1 0.9 0.9 0.7 0.6 1.1 1.1
Operating cash-flow 14.1 19.0 (11.4) (2.7) 15.2 12.6 6.8 11.4 7.6 5.1 3.4
FINANCIAL INFORMATION 2011
144