Volvo 2011 Annual Report Download - page 15
Download and view the complete annual report
Please find page 15 of the 2011 Volvo annual report below. You can navigate through the pages in the report by either clicking on the pages listed below, or by using the keyword search tool below to find specific information within the annual report.-
 1
1 -
2
-
3
-
4
-
 5
5 -
 6
6 -
 7
7 -
 8
8 -
 9
9 -
 10
10 -
 11
11 -
 12
12 -
 13
13 -
 14
14 -
 15
15 -
 16
16 -
 17
17 -
 18
18 -
 19
19 -
 20
20 -
 21
21 -
 22
22 -
 23
23 -
 24
24 -
 25
25 -
26
-
27
-
28
-
29
-
30
-
31
-
32
-
33
-
34
-
35
-
36
-
37
-
38
-
39
-
40
-
41
-
42
-
43
-
44
-
45
-
46
-
47
-
48
-
49
-
50
-
51
-
52
-
53
-
54
-
55
-
56
-
57
-
58
-
59
-
60
-
61
-
62
-
63
-
64
-
65
-
66
-
67
-
68
-
69
-
70
-
71
-
72
-
73
-
74
-
75
-
76
-
77
-
78
-
79
-
80
-
81
-
82
-
83
-
84
-
85
-
86
-
87
-
88
-
89
-
90
-
91
-
92
-
93
-
94
-
95
-
96
-
97
-
98
-
99
-
100
-
101
-
102
-
103
-
104
-
105
-
106
-
107
-
108
-
109
-
110
-
111
-
112
-
113
-
114
-
115
-
116
-
117
-
118
-
119
-
120
-
121
-
122
-
123
-
124
-
125
-
126
-
127
-
128
-
129
-
130
-
131
-
132
-
133
-
134
-
135
-
136
-
137
-
138
-
139
-
140
-
141
-
142
-
143
-
144
-
145
-
146
-
147
-
148
-
149
-
150
-
151
-
152
-
153
-
154
-
155
-
156
-
157
-
158
-
159
-
160
-
161
-
162
-
163
-
164
-
165
-
166
 |
 |

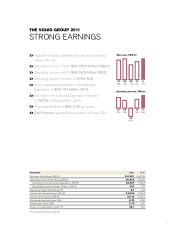
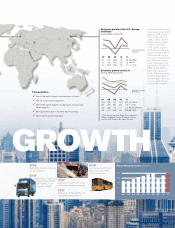
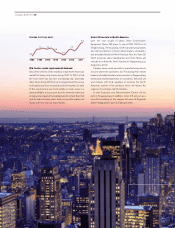
Volvo Group net sales, SEK bn
02 03 04 05 06 07 08 09 10 11
0
75
150
225
300
Economic growth in the U.S., Europe
and Brazil
Annual GDP-growth, %
Source: Consensus
Economics
1110090807
1.61.9(4.1)0.63.1 EU
2.97.5(0.3)5.26.1 Brazil
1.7 USA
3.0(3.5)(0.3)1.9
Economic growth in Asia, %
Annual GDP-growth, %
1110090807
4.4
7.11.93.87.2 Asia/Pacific*
7.0
8.58.06.89.0 India
(0.9) Japan
4.5(5.5)(1.1)2.3
* China, Hong Kong, South Korea, Taiwan, Indonesia,
Malaysia, Singapore, Thailand, Phillippines, Vietnam,
Australia, New Zealand, India, Japan, Sri Lanka
9.2 China
10.49.29.614.2
Source: Consensus
Economics
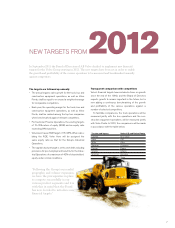
According to Consensus
Economics, global GDP
grew by 2.9% during
2011 compared with
4.3% in 2010. GDP in
the EU grew by 1.6%
(1.9%), in the US by
1.7% (3.0%). Japan’s
GDP fell by 0.9% after
having risen by 4.5% in
2010. Growth in coun-
tries such as Brazil, India
and China was damp-
ened compared to the
high levels of 2010. For
2012, global GDP is
expected to grow by
2.6%. The fast-growing
economies primarily in
Asia and Latin America
continue to be the pri-
mary growth engines.
2005
Sale of the service company
Celero Support.
2006
Acquisition of Japanese
Nissan Diesel (Now
UD Trucks). Com-
pleted in 2007.
2007
Acquisition of Chinese wheel
loader manufacturer Lingong.
2007
Acquisition of Ingersoll Rand’s
road development division.
2008
Joint venture with Eicher
Motors of India within
trucks and buses.
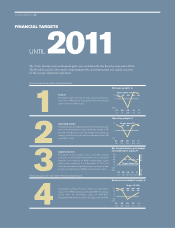
GROWTH
Strong positions
One of the world’s largest manufacturers of trucks.
No. 3 in construction equipment.
One of the world’s largest manufacturers of heavy-duty
diesel engines.
Strong positions also in the other business areas.
Good market presence globally.
11