Volvo 2011 Annual Report Download - page 116
Download and view the complete annual report
Please find page 116 of the 2011 Volvo annual report below. You can navigate through the pages in the report by either clicking on the pages listed below, or by using the keyword search tool below to find specific information within the annual report.-
 1
1 -
2
-
3
-
4
-
5
-
6
-
7
-
8
-
9
-
10
-
11
-
12
-
13
-
14
-
15
-
16
-
17
-
18
-
19
-
20
-
21
-
22
-
23
-
24
-
25
-
26
-
27
-
28
-
29
-
30
-
31
-
32
-
33
-
34
-
35
-
36
-
37
-
38
-
39
-
40
-
41
-
42
-
43
-
44
-
45
-
46
-
47
-
48
-
49
-
50
-
51
-
52
-
53
-
54
-
55
-
56
-
57
-
58
-
59
-
60
-
61
-
62
-
63
-
64
-
65
-
66
-
67
-
68
-
69
-
70
-
71
-
72
-
73
-
74
-
75
-
76
-
77
-
78
-
79
-
80
-
81
-
82
-
83
-
84
-
85
-
86
-
87
-
88
-
89
-
90
-
91
-
92
-
93
-
94
-
95
-
96
-
97
-
98
-
99
-
100
-
101
-
102
-
103
-
104
-
105
-
 106
106 -
 107
107 -
 108
108 -
 109
109 -
 110
110 -
 111
111 -
 112
112 -
 113
113 -
 114
114 -
 115
115 -
 116
116 -
 117
117 -
 118
118 -
 119
119 -
 120
120 -
 121
121 -
 122
122 -
 123
123 -
 124
124 -
 125
125 -
 126
126 -
127
-
128
-
129
-
130
-
131
-
132
-
133
-
134
-
135
-
136
-
137
-
138
-
139
-
140
-
141
-
142
-
143
-
144
-
145
-
146
-
147
-
148
-
149
-
150
-
151
-
152
-
153
-
154
-
155
-
156
-
157
-
158
-
159
-
160
-
161
-
162
-
163
-
164
-
165
-
166
 |
 |

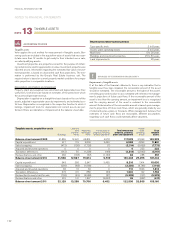
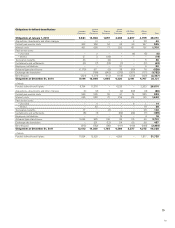
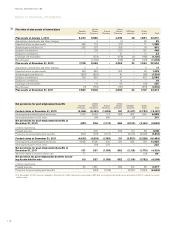
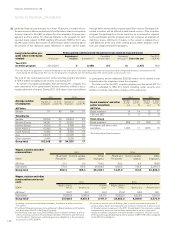
Fair value of plan assets in funded plans Sweden
Pensions
United
States
Pensions France
Pensions
Great
Britain
Pensions US Other
benefits Other
plans Total
Plan assets at January 1, 2010 6,430 9,866 – 4,392 28 1,894 22,610
Acquisitions, divestments and other changes – 4 – (1) – 26 29
Expected return on plan assets 386 719 – 216 – 77 1,398
Actuarial gains and (losses) 262 373 – 208 – 18 861
Employer contributions – 156 – 103 – 187 446
Employee contributions – – – 21 – 12 33
Exchange rate translation – (574) – (378) (2) (166) (1,120)
Benefits paid – (1,009) – (168) (2) (124) (1,303)
Plan assets at December 31, 2010 7,078 9,535 – 4,393 24 1,924 22,954
Acquisitions, divestments and other changes 3 8 – – – 6 17
Expected return on plan assets 426 683 – 204 – 92 1,405
Actuarial gains and (losses) (681) (628) – 81 – (96) (1,324)
Employer contributions 756 829 – 91 – 410 2,086
Employee contributions – – – 12 – 7 19
Exchange rate translation – 178 – 60 – (18) 220
Benefits paid (2) (763) – (161) – (578) (1,504)
Plan assets at December 31, 2011 7,580 9,842 – 4,680 24 1,747 23,873
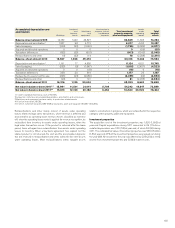
Net provisions for post-employment benefits Sweden
Pensions
United
States
Pensions France
Pensions
Great
Britain
Pensions US Other
benefits Other
plans Total
Funded status at December 31, 2010 (2,066) (3,463) (1,605) 167 (3,417) (2,783) (13,167)
Unrecognized actuarial (gains) and losses 1,475 4,054 113 388 322 643 6,995
Unrecognized past service costs – (65) 380 – (5) – 310
Net provisions for post-employment benefits at
December 31, 2010 (591) 526 (1,112) 555 (3,100) (2,140) (5,862)
of which reported as
Prepaid pensions – 900 – 555 110 83 1,648
Provisions for post-employment benefits (591) (374) (1,112) – (3,210) (2,223) (7,510)
Funded status at December 31, 2011 (4,432) (4,518) (1,765) 311 (3,553) (2,528) (16,485)
Unrecognized actuarial (gains) and losses 4,569 5,509 333 341 434 753 11,939
Unrecognized past service costs – (54) 276 – – – 222
Net provisions for post-employment benefits at
December 31, 2011 137 937 (1,156) 652 (3,119) (1,775) (4,324)
Whereof related to Assets held for sale 77 – – – – (13) 641
Net provision for post-employment benefits exclud-
ing Assets held for sale 60 937 (1,156) 652 (3,119) (1,762) (4,388)
of which reported as
Prepaid pensions 60 1,381 – 652 102 82 2,277
Provisions for post-employment benefits – (444) (1,156) – (3,221) (1,844) (6,665)
1 Per December 31, 2011 pension obligation amounted to 1,394, plan assets amounted to 926 and unrecognized actuarial losses amounted to 532 in regards to Assets
held for sale.
NOTES TO FINANCIAL STATEMENTS
FINANCIAL INFORMATION 2011
112