Volvo 2011 Annual Report Download - page 94
Download and view the complete annual report
Please find page 94 of the 2011 Volvo annual report below. You can navigate through the pages in the report by either clicking on the pages listed below, or by using the keyword search tool below to find specific information within the annual report.-
 1
1 -
2
-
3
-
4
-
5
-
6
-
7
-
8
-
9
-
10
-
11
-
12
-
13
-
14
-
15
-
16
-
17
-
18
-
19
-
20
-
21
-
22
-
23
-
24
-
25
-
26
-
27
-
28
-
29
-
30
-
31
-
32
-
33
-
34
-
35
-
36
-
37
-
38
-
39
-
40
-
41
-
42
-
43
-
44
-
45
-
46
-
47
-
48
-
49
-
50
-
51
-
52
-
53
-
54
-
55
-
56
-
57
-
58
-
59
-
60
-
61
-
62
-
63
-
64
-
65
-
66
-
67
-
68
-
69
-
70
-
71
-
72
-
73
-
74
-
75
-
76
-
77
-
78
-
79
-
80
-
81
-
82
-
83
-
 84
84 -
 85
85 -
 86
86 -
 87
87 -
 88
88 -
 89
89 -
 90
90 -
 91
91 -
 92
92 -
 93
93 -
 94
94 -
 95
95 -
 96
96 -
 97
97 -
 98
98 -
 99
99 -
 100
100 -
 101
101 -
 102
102 -
 103
103 -
 104
104 -
105
-
106
-
107
-
108
-
109
-
110
-
111
-
112
-
113
-
114
-
115
-
116
-
117
-
118
-
119
-
120
-
121
-
122
-
123
-
124
-
125
-
126
-
127
-
128
-
129
-
130
-
131
-
132
-
133
-
134
-
135
-
136
-
137
-
138
-
139
-
140
-
141
-
142
-
143
-
144
-
145
-
146
-
147
-
148
-
149
-
150
-
151
-
152
-
153
-
154
-
155
-
156
-
157
-
158
-
159
-
160
-
161
-
162
-
163
-
164
-
165
-
166
 |
 |

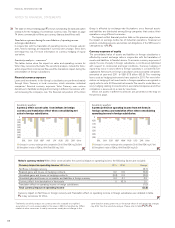
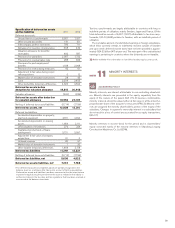
LIQUIDITY RISKS
Liquidity risk is defined as the risk that Volvo would be unable to finance
or refinance its assets or fulfill its payment obligations.
POLICY
Volvo assures itself of sound financial preparedness by always keeping a
certain percentage of its sales in liquid assets. A sound balance between
short and long-term borrowing, as well as borrowing preparedness in the
form of overdraft facilities, are intended to meet its long-term financing
needs.
LIQU IDIT Y RISKS
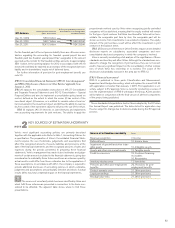
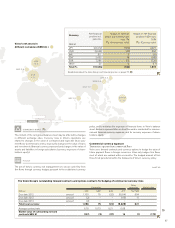
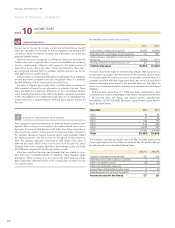
The adjacent graph J shows expected future cash-flows including deriv-
atives related to financial liabilities. Capital flow refers to expected pay-
ments of loans and derivatives, see note 22. Expected interest flow refers
to the future interest payments on loans and derivatives based on interest
rates expected by the market. The interest flow is recognized within cash
flow from operating activities.
In addition to derivatives included in capital flow in the table there are
also derivatives related to financial liabilities reported as assets, which are
expected to give a future capital flow of SEK 0.8 bn and a future interest
flow of SEK 3.4 bn.
Read more about the maturity structure concerning bond loans and other
loans, as well as granted but unutilized credit facilities in Note 22.
Read more about contractual term analyses of Volvo’s future rental payments
from non-annullable financial and operational lease contracts in Note 14.
Future cash-flow including derivatives related to non-current
and current financial liabilities
Capital flow, SEK bn
Interest flow, SEK bn
2018
(0.7)
(0)
2015
(11.3)
(1.3)
2016
(13.0)
(0.9)
2017
(11.8)
(0.6)
2014
(20.9)
(2.7)
2013
(28.2)
(3.3)
2012
(44.5)
(5.6)
(50)
0
(40)
(30)
(20)
(10)
J
NOTES TO FINANCIAL STATEMENTS
FINANCIAL INFORMATION 2011
90