Volvo 2011 Annual Report Download - page 5
Download and view the complete annual report
Please find page 5 of the 2011 Volvo annual report below. You can navigate through the pages in the report by either clicking on the pages listed below, or by using the keyword search tool below to find specific information within the annual report.-
 1
1 -
 2
2 -
 3
3 -
 4
4 -
 5
5 -
 6
6 -
 7
7 -
 8
8 -
 9
9 -
 10
10 -
 11
11 -
 12
12 -
 13
13 -
 14
14 -
 15
15 -
 16
16 -
17
-
18
-
19
-
20
-
21
-
22
-
23
-
24
-
25
-
26
-
27
-
28
-
29
-
30
-
31
-
32
-
33
-
34
-
35
-
36
-
37
-
38
-
39
-
40
-
41
-
42
-
43
-
44
-
45
-
46
-
47
-
48
-
49
-
50
-
51
-
52
-
53
-
54
-
55
-
56
-
57
-
58
-
59
-
60
-
61
-
62
-
63
-
64
-
65
-
66
-
67
-
68
-
69
-
70
-
71
-
72
-
73
-
74
-
75
-
76
-
77
-
78
-
79
-
80
-
81
-
82
-
83
-
84
-
85
-
86
-
87
-
88
-
89
-
90
-
91
-
92
-
93
-
94
-
95
-
96
-
97
-
98
-
99
-
100
-
101
-
102
-
103
-
104
-
105
-
106
-
107
-
108
-
109
-
110
-
111
-
112
-
113
-
114
-
115
-
116
-
117
-
118
-
119
-
120
-
121
-
122
-
123
-
124
-
125
-
126
-
127
-
128
-
129
-
130
-
131
-
132
-
133
-
134
-
135
-
136
-
137
-
138
-
139
-
140
-
141
-
142
-
143
-
144
-
145
-
146
-
147
-
148
-
149
-
150
-
151
-
152
-
153
-
154
-
155
-
156
-
157
-
158
-
159
-
160
-
161
-
162
-
163
-
164
-
165
-
166
 |
 |

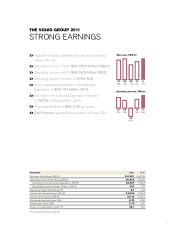
THE VOLVO GROUP 2011
STRONG EARNINGS
Key ratios 2011 2010
Net sales Volvo Group, SEK M 310,367 264,749
Operating income Volvo Group, SEK M 26,899 18,000
Operating income Industrial Operations, SEK M 25,957 17,834
Operating income Customer Finance, SEK M 942 167
Operating margin Volvo Group, % 8.7 6.8
Income after financial items, SEK M 24,929 15,514
Income for the period, SEK M 18,115 11,212
Diluted earnings per share, SEK 8.75 5.36
Dividend per share, SEK 3.0012.50
Return on shareholders’ equity, % 23.1 16.0
1 According to the Board’s proposal.
Highest net sales, operating income and operating
margin thus far
Net sales rose by 17% to SEK 310.4 billion (264.7)
Operating income rose to SEK 26.9 billion (18.0)
Operating margin improved to 8.7% (6.8)
Strong operating cash-flow in the Industrial
Operations of SEK 14.1 billion (19.0)
Net debt in the Industrial Operations reduced
to 25.2% of shareholders’ equity
Proposed dividend of SEK 3.00 per share
Olof Persson assumed the position of Group CEO
Net sales, SEK bn
1110090807
310265218304285
Operating income, SEK bn
080807
09
(17.0)
15,915.922.2
11
26.9
10
18.0
1