Vodafone 2005 Annual Report Download - page 98
Download and view the complete annual report
Please find page 98 of the 2005 Vodafone annual report below. You can navigate through the pages in the report by either clicking on the pages listed below, or by using the keyword search tool below to find specific information within the annual report.-
 1
1 -
2
-
3
-
4
-
5
-
6
-
7
-
8
-
9
-
10
-
11
-
12
-
13
-
14
-
15
-
16
-
17
-
18
-
19
-
20
-
21
-
22
-
23
-
24
-
25
-
26
-
27
-
28
-
29
-
30
-
31
-
32
-
33
-
34
-
35
-
36
-
37
-
38
-
39
-
40
-
41
-
42
-
43
-
44
-
45
-
46
-
47
-
48
-
49
-
50
-
51
-
52
-
53
-
54
-
55
-
56
-
57
-
58
-
59
-
60
-
61
-
62
-
63
-
64
-
65
-
66
-
67
-
68
-
69
-
70
-
71
-
72
-
73
-
74
-
75
-
76
-
77
-
78
-
79
-
80
-
81
-
82
-
83
-
84
-
85
-
86
-
87
-
 88
88 -
 89
89 -
 90
90 -
 91
91 -
 92
92 -
 93
93 -
 94
94 -
 95
95 -
 96
96 -
 97
97 -
 98
98 -
 99
99 -
 100
100 -
 101
101 -
 102
102 -
 103
103 -
 104
104 -
 105
105 -
 106
106 -
 107
107 -
 108
108 -
109
-
110
-
111
-
112
-
113
-
114
-
115
-
116
-
117
-
118
-
119
-
120
-
121
-
122
-
123
-
124
-
125
-
126
-
127
-
128
-
129
-
130
-
131
-
132
-
133
-
134
-
135
-
136
-
137
-
138
-
139
-
140
-
141
-
142
-
143
-
144
-
145
-
146
-
147
-
148
-
149
-
150
-
151
-
152
-
153
-
154
-
155
-
156
 |
 |

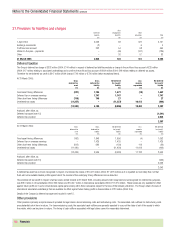
Notes to the Consolidated Financial Statements continued
96 |Financials
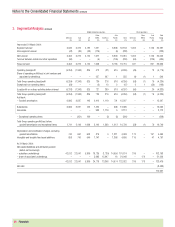
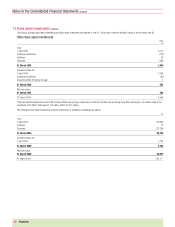
12.Tangible fixed assets
Equipment,
Land and fixtures Network
buildings and fittings infrastructure Total
£m £m £m £m
Cost:
1 April 2004 1,214 5,979 23,371 30,564
Exchange movements 9 57 (37) 29
Additions 126 1,690 3,250 5,066
Disposals (23) (274) (419) (716)
31 March 2005 1,326 7,452 26,165 34,943
Accumulated depreciation and impairment:
1 April 2004 293 3,640 8,548 12,481
Exchange movements 4 27 – 31
Charge for the year 86 1,144 3,298 4,528
Disposals (10) (184) (301) (495)
31 March 2005 373 4,627 11,545 16,545
Net book value:
31 March 2005 953 2,825 14,620 18,398
31 March 2004 921 2,339 14,823 18,083
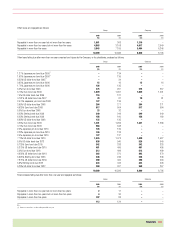
The total net book value of land and buildings held by the Group comprises:
2005 2004
£m £m
Freehold premises included in:
– Land and buildings 597 586
– Network infrastructure 309 284
906 870
Long-term leasehold premises included in:
– Land and buildings 114 115
Short term leasehold premises included in:
– Land and buildings 242 220
– Network infrastructure 1,537 1,348
1,779 1,568
Total 2,799 2,553
Network infrastructure and equipment include the following amounts in respect of finance leases:
2005 2004
£m £m
Cost 309 614
Accumulated depreciation (184) (454)
Net book value 125 160
Liabilities under leases for network infrastructure assets, with an original cost of £104 million and net book value at 31 March 2005 of £20 million, have been unconditionally
satisfied by call deposits and other assets, trust deed and set-off arrangements. Accordingly, lease liabilities and the corresponding financial assets in respect of these
network infrastructure assets are not included in the Group’s balance sheet.