Vodafone 2005 Annual Report Download - page 54
Download and view the complete annual report
Please find page 54 of the 2005 Vodafone annual report below. You can navigate through the pages in the report by either clicking on the pages listed below, or by using the keyword search tool below to find specific information within the annual report.-
 1
1 -
2
-
3
-
4
-
5
-
6
-
7
-
8
-
9
-
10
-
11
-
12
-
13
-
14
-
15
-
16
-
17
-
18
-
19
-
20
-
21
-
22
-
23
-
24
-
25
-
26
-
27
-
28
-
29
-
30
-
31
-
32
-
33
-
34
-
35
-
36
-
37
-
38
-
39
-
40
-
41
-
42
-
43
-
 44
44 -
 45
45 -
 46
46 -
 47
47 -
 48
48 -
 49
49 -
 50
50 -
 51
51 -
 52
52 -
 53
53 -
 54
54 -
 55
55 -
 56
56 -
 57
57 -
 58
58 -
 59
59 -
 60
60 -
 61
61 -
 62
62 -
 63
63 -
 64
64 -
65
-
66
-
67
-
68
-
69
-
70
-
71
-
72
-
73
-
74
-
75
-
76
-
77
-
78
-
79
-
80
-
81
-
82
-
83
-
84
-
85
-
86
-
87
-
88
-
89
-
90
-
91
-
92
-
93
-
94
-
95
-
96
-
97
-
98
-
99
-
100
-
101
-
102
-
103
-
104
-
105
-
106
-
107
-
108
-
109
-
110
-
111
-
112
-
113
-
114
-
115
-
116
-
117
-
118
-
119
-
120
-
121
-
122
-
123
-
124
-
125
-
126
-
127
-
128
-
129
-
130
-
131
-
132
-
133
-
134
-
135
-
136
-
137
-
138
-
139
-
140
-
141
-
142
-
143
-
144
-
145
-
146
-
147
-
148
-
149
-
150
-
151
-
152
-
153
-
154
-
155
-
156
 |
 |

Non-GAAP Information
52 |Performance
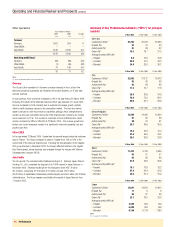
Cash flow measures
In presenting and discussing the Group’s reported results, free cash flow and operating free cash flow are calculated and presented on the basis of methodologies other than in
accordance with UK GAAP. The Group believes that it is both useful and necessary to communicate free cash flow to investors and other interested parties, for the following
reasons:
•free cash flow allows the Company and external parties to evaluate the Group’s liquidity and the cash generated by the Group’s operations. Free cash flow does not include
items determined independently of the ongoing business, such as the level of dividends, and items which are deemed discretionary, such as cash flows relating to acquisitions
and disposals or financing activities. In addition, it does not necessarily reflect the amounts which the Group has an obligation to incur. However, it does reflect the cash
available for such discretionary activities, to strengthen the balance sheet or to provide returns to shareholders in the form of dividends or share purchases;
•free cash flow facilitates comparability of results with other companies, although the Group’s measure of free cash flow may not be directly comparable to similarly titled
measures used by other companies;
•it is used by management for planning, reporting and incentive purposes; and
•it is useful in connection with discussion with the investment analyst community and the debt rating agencies.
The Group believes that the presentation of operating free cash flow is useful and necessary for investors and other interested parties as it provides the quantitative basis for the
cash flow targets of the One Vodafone initiatives outlined on page 13. This measure may not be directly comparable to similarly titled measures used by other companies.
A reconciliation of net cash inflow from operating activities, the closest equivalent GAAP measure, to free cash flow and operating free cash flow, is shown below:
Years ended 31 March
2005 2004 2003 2002 2001
£m £m £m £m £m
Net cash inflow from operating activities 12,713 12,317 11,142 8,102 4,587
Purchase of intangible fixed assets (59) (21) (99) (325) (13,163)
Purchase of tangible fixed assets (4,890) (4,508) (5,289) (4,145) (3,698)
Disposal of tangible fixed assets 70 158 109 75 275
Operating free cash flow 7,834 7,946 5,863 3,707 (11,999)
Dividends received from joint ventures and associated undertakings 2,020 1,801 742 139 353
Taxation (1,616) (1,182) (883) (545) (1,585)
Net cash outflow for returns on investments and servicing of finance (391) (44) (551) (936) (47)
Free cash flow 7,847 8,521 5,171 2,365 (13,278)
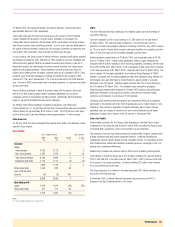
Organic growth
The Group believes that “organic growth”, which is not intended to be a substitute, or superior to, reported growth, provides useful and necessary information to investors and other
interested parties for the following reasons:
•it provides additional information on underlying growth of the business without the effect of factors unrelated to the operating performance of the business;
•it is used by the Group for internal performance analysis; and
•it facilities comparability of underlying growth with other companies, although the term “organic”is not a defined term under UK or US GAAP, and may not, therefore, be
comparable with similarly titled measures reported by other companies.
Reconciliation of organic growth to reported growth is shown below:
Organic Impact of foreign Impact of acquisitions Reported
growth exchange and disposals growth
%%%%
Turnover
Mobile telecommunications Voice revenue 4 (2) 1 3
Non-voice revenue 11 (2) 1 10
Total service revenue 5 (2) 1 4
Acquisition and retention revenue 7 (3) 1 5
Total 5 (2) 1 4
Total 6 (2) (2) 2