Vodafone 2005 Annual Report Download - page 83
Download and view the complete annual report
Please find page 83 of the 2005 Vodafone annual report below. You can navigate through the pages in the report by either clicking on the pages listed below, or by using the keyword search tool below to find specific information within the annual report.-
 1
1 -
2
-
3
-
4
-
5
-
6
-
7
-
8
-
9
-
10
-
11
-
12
-
13
-
14
-
15
-
16
-
17
-
18
-
19
-
20
-
21
-
22
-
23
-
24
-
25
-
26
-
27
-
28
-
29
-
30
-
31
-
32
-
33
-
34
-
35
-
36
-
37
-
38
-
39
-
40
-
41
-
42
-
43
-
44
-
45
-
46
-
47
-
48
-
49
-
50
-
51
-
52
-
53
-
54
-
55
-
56
-
57
-
58
-
59
-
60
-
61
-
62
-
63
-
64
-
65
-
66
-
67
-
68
-
69
-
70
-
71
-
72
-
 73
73 -
 74
74 -
 75
75 -
 76
76 -
 77
77 -
 78
78 -
 79
79 -
 80
80 -
 81
81 -
 82
82 -
 83
83 -
 84
84 -
 85
85 -
 86
86 -
 87
87 -
 88
88 -
 89
89 -
 90
90 -
 91
91 -
 92
92 -
 93
93 -
94
-
95
-
96
-
97
-
98
-
99
-
100
-
101
-
102
-
103
-
104
-
105
-
106
-
107
-
108
-
109
-
110
-
111
-
112
-
113
-
114
-
115
-
116
-
117
-
118
-
119
-
120
-
121
-
122
-
123
-
124
-
125
-
126
-
127
-
128
-
129
-
130
-
131
-
132
-
133
-
134
-
135
-
136
-
137
-
138
-
139
-
140
-
141
-
142
-
143
-
144
-
145
-
146
-
147
-
148
-
149
-
150
-
151
-
152
-
153
-
154
-
155
-
156
 |
 |

Financials |81
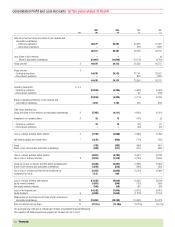
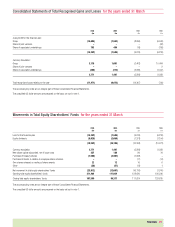
2005 2005 2004 2003
$m £m £m £m
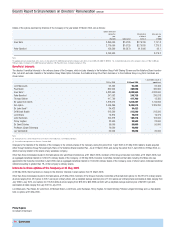
(Loss)/profit for the financial year:
Group (15,005) (7,944) (8,996) (9,049)
Share of joint ventures –––(62)
Share of associated undertakings 763 404 (19) (708)
(14,242) (7,540) (9,015) (9,819)
Currency translation:
Group 3,175 1,681 (2,462) 10,484
Share of joint ventures ––– 2
Share of associated undertakings (404) (214) (2,830) (1,447)
2,771 1,467 (5,292) 9,039
Total recognised losses relating to the year (11,471) (6,073) (14,307) (780)
The accompanying notes are an integral part of these Consolidated Financial Statements.
The unaudited US dollar amounts are prepared on the basis set out in note 1.
Movements in Total Equity Shareholders’ Funds for the years ended 31 March
2005 2005 2004 2003
$m £m £m £m
Loss for the financial year (14,242) (7,540) (9,015) (9,819)
Equity dividends (5,020) (2,658) (1,378) (1,154)
(19,262) (10,198) (10,393) (10,973)
Currency translation 2,771 1,467 (5,292) 9,039
New share capital subscribed, net of issue costs 257 136 86 31
Purchase of treasury shares (7,550) (3,997) (1,088) –
Purchase of shares in relation to employee share schemes ––(17) (14)
Own shares released on vesting of share awards 22 12 10 6
Other (50) (27) (12) 1
Net movement in total equity shareholders’ funds (23,812) (12,607) (16,706) (1,910)
Opening total equity shareholders’ funds 211,402 111,924 128,630 130,540
Closing total equity shareholders’ funds 187,590 99,317 111,924 128,630
The accompanying notes are an integral part of these Consolidated Financial Statements.
The unaudited US dollar amounts are prepared on the basis set out in note 1.
Consolidated Statements of Total Recognised Gains and Losses for the years ended 31 March