Vodafone 2005 Annual Report Download - page 136
Download and view the complete annual report
Please find page 136 of the 2005 Vodafone annual report below. You can navigate through the pages in the report by either clicking on the pages listed below, or by using the keyword search tool below to find specific information within the annual report.-
 1
1 -
2
-
3
-
4
-
5
-
6
-
7
-
8
-
9
-
10
-
11
-
12
-
13
-
14
-
15
-
16
-
17
-
18
-
19
-
20
-
21
-
22
-
23
-
24
-
25
-
26
-
27
-
28
-
29
-
30
-
31
-
32
-
33
-
34
-
35
-
36
-
37
-
38
-
39
-
40
-
41
-
42
-
43
-
44
-
45
-
46
-
47
-
48
-
49
-
50
-
51
-
52
-
53
-
54
-
55
-
56
-
57
-
58
-
59
-
60
-
61
-
62
-
63
-
64
-
65
-
66
-
67
-
68
-
69
-
70
-
71
-
72
-
73
-
74
-
75
-
76
-
77
-
78
-
79
-
80
-
81
-
82
-
83
-
84
-
85
-
86
-
87
-
88
-
89
-
90
-
91
-
92
-
93
-
94
-
95
-
96
-
97
-
98
-
99
-
100
-
101
-
102
-
103
-
104
-
105
-
106
-
107
-
108
-
109
-
110
-
111
-
112
-
113
-
114
-
115
-
116
-
117
-
118
-
119
-
120
-
121
-
122
-
123
-
124
-
125
-
 126
126 -
 127
127 -
 128
128 -
 129
129 -
 130
130 -
 131
131 -
 132
132 -
 133
133 -
 134
134 -
 135
135 -
 136
136 -
 137
137 -
 138
138 -
 139
139 -
 140
140 -
 141
141 -
 142
142 -
 143
143 -
 144
144 -
 145
145 -
 146
146 -
147
-
148
-
149
-
150
-
151
-
152
-
153
-
154
-
155
-
156
 |
 |

Notes to the Consolidated Financial Statements continued
134 |Financials
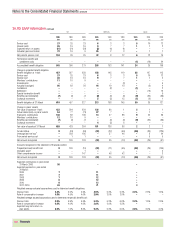
36.US GAAP information continued
UK Germany Japan
2005 2004 2003 2005 2004 2003 2005 2004 2003
£m £m £m £m £m £m £m £m £m
Service cost 37 25 23 633510 12
Interest costs 26 19 16 977112
Expected return on assets (31) (21) (23) (8) (4) (1) –––
Actuarial gains and losses 72 16 9 25 23–11
Net periodic pension cost 104 39 25 32 812 612 15
Termination benefits and
curtailment costs ––––––(1) (16) 24
Accumulated benefit obligation 545 390 279 208 153 141 24 25 106
Change in projected benefit obligation:
Benefit obligation at 1 April 457 327 258 158 145 119 35 127 115
Service cost 37 25 23 633510 12
Interest cost 26 19 16 977112
Members’ contributions 11 10 9 ––––––
Amendments –––––(3) –– 5
Actuarial loss/(gain) 95 82 28 44 19 13 –(3) 4
Curtailment ––––(2) –(1) – 2
Settlement –––––––(76) 13
Special termination benefit –––––––– 9
Benefits paid (estimated) (7) (6) (7) (9) (9) (9) (9) (22) (36)
Exchange movement –––5(5) 15 (1) (2) 1
Benefit obligation at 31 March 619 457 327 213 158 145 30 35 127
Change in plans’ assets:
Fair value of assets at 1 April 433 264 229 136 86 1 211
Actual return/(loss) on plans’ assets 54 77 (73) 27 7 – –1 –
Employer’s contributions 136 88 106 14 57 88 922 36
Members’ contributions 12 10 9 ––––––
Benefits paid (estimated) (7) (6) (7) –(9) (9) (9) (22) (36)
Exchange movement –––4(5) 6 –––
Fair value of assets at 31 March 628 433 264 181 136 86 221
Funded status 9(24) (63) (32) (22) (59) (28) (33) (126)
Unrecognised net loss(1) –203 195 –57 46 –324
Prior period service cost –11––––55
Net amount recognised 9180 133 (32) 35 (13) (28) (25) (97)
Amounts recognised in the statement of financial position:
Prepaid/(accrued) benefit cost 9180 (15) (32) (11) (55) (28) (25) (105)
Intangible asset –– 1 ––––– 5
Other comprehensive income –– 147 –46 42 –– 3
Net amount recognised 9180 133 (32) 35 (13) (28) (25) (97)
Expected contributions in year ended
31 March 2006 36 ––
Expected payments in year ended
31 March:
2006 711 –
2007 711 –
2008 712 –
2009 812 –
2010 813 –
2011-2016 43 71 3
Weighted-average actuarial assumptions used to determine benefit obligations:
Discount rate 5.4% 5.5% 5.9% 4.5% 5.3% 5.3% 2.3% 2.3% 1.5%
Rate of compensation increase 4.8% 4.5% 4.0% 2.9% 3.0% 2.0% –––
Weighted-average actuarial assumptions used to determine net periodic benefit cost:
Discount rate 5.5% 5.9% 6.5% 5.3% 5.3% 6.0% 2.3% 1.5% 2.5%
Rate of compensation increase 4.5% 4.0% 4.0% 3.0% 2.0% 2.5% –––
Expected long-term return on
plan assets 6.9% 7.5% 8.0% 5.3% 5.3% 6.0% 2.8% 3.0% 4.4%