Vodafone 2005 Annual Report Download - page 41
Download and view the complete annual report
Please find page 41 of the 2005 Vodafone annual report below. You can navigate through the pages in the report by either clicking on the pages listed below, or by using the keyword search tool below to find specific information within the annual report.-
 1
1 -
2
-
3
-
4
-
5
-
6
-
7
-
8
-
9
-
10
-
11
-
12
-
13
-
14
-
15
-
16
-
17
-
18
-
19
-
20
-
21
-
22
-
23
-
24
-
25
-
26
-
27
-
28
-
29
-
30
-
 31
31 -
 32
32 -
 33
33 -
 34
34 -
 35
35 -
 36
36 -
 37
37 -
 38
38 -
 39
39 -
 40
40 -
 41
41 -
 42
42 -
 43
43 -
 44
44 -
 45
45 -
 46
46 -
 47
47 -
 48
48 -
 49
49 -
 50
50 -
 51
51 -
52
-
53
-
54
-
55
-
56
-
57
-
58
-
59
-
60
-
61
-
62
-
63
-
64
-
65
-
66
-
67
-
68
-
69
-
70
-
71
-
72
-
73
-
74
-
75
-
76
-
77
-
78
-
79
-
80
-
81
-
82
-
83
-
84
-
85
-
86
-
87
-
88
-
89
-
90
-
91
-
92
-
93
-
94
-
95
-
96
-
97
-
98
-
99
-
100
-
101
-
102
-
103
-
104
-
105
-
106
-
107
-
108
-
109
-
110
-
111
-
112
-
113
-
114
-
115
-
116
-
117
-
118
-
119
-
120
-
121
-
122
-
123
-
124
-
125
-
126
-
127
-
128
-
129
-
130
-
131
-
132
-
133
-
134
-
135
-
136
-
137
-
138
-
139
-
140
-
141
-
142
-
143
-
144
-
145
-
146
-
147
-
148
-
149
-
150
-
151
-
152
-
153
-
154
-
155
-
156
 |
 |

Performance |39
of an agreement with the Egyptian Government for the purchase of additional
spectrum.
EMEA associates
Associates in EMEA increased their average customer bases by 20% in the year, with
particularly strong growth in markets with relatively low penetration rates such as those
in Eastern Europe and Africa. This customer growth generated an increase in operating
profit of 6%.
SFR, the Group’s associated undertaking in France, reported strong growth in revenue
and operating profit before goodwill amortisation, principally as a result of a 9%
increase in average customers compared to the prior year. Usage of both voice and
non-voice services grew in the period and SFR had a total of 2.6 million Vodafone live!
customers at 31 March 2005. SFR launched the Vodafone Mobile Connect 3G/GPRS
data card in May 2004 and Vodafone live! with 3G in November 2004 and it also
markets BlackBerry from Vodafone products.
Vodacom continued to grow both in South Africa and internationally through its interests
in the Democratic Republic of the Congo, Lesotho, Mozambique and Tanzania. Venture
customers at 31 March 2005 totalled 15,482,000, an increase of 5,757,000 over the
previous year, including 2,645,000 customers in Vodacom’s international interests which
were previously excluded from the Group’s reported customer base. In April 2005,
Vodacom launched Vodafone live! with 3G in South Africa building on the successful
launch of the Vodafone Mobile Connect 3G/GPRS data card in December 2004.
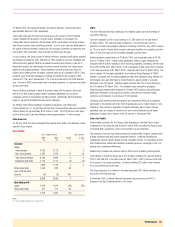
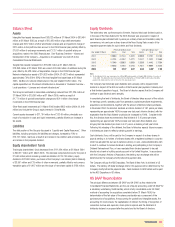
Americas
Years ended 31 March Local currency
2005 2004 Change change
£m £m % %
Operating profit/(loss)(1)
Verizon Wireless 1,647 1,406 17 28
Other Americas –(13)
1,647 1,393 18
Notes:
(1) Total Group operating profit before goodwill amortisation
United States
In a highly competitive US market, Verizon Wireless continued to outperform its
competitors, ranking first in customer net additions for the year ended 31 March 2005.
The total customer base increased by 17% in the financial year to 45,452,000 at
31 March 2005. At 31 December 2004, US market penetration reached approximately
63%, with Verizon Wireless’ market share at approximately 24%.
In local currency, proportionate turnover increased by 23%, driven by the larger
customer base and an increase in ARPU. ARPU growth was generated primarily by
customers migrating to higher access price plans as well as growth in data products,
with data revenue increasing 131% over last year and representing 5.0% of service
revenue in the year.
Churn rates are amongst the lowest in the US wireless industry and have continued to
improve, falling from 20.5% to 17.2%. The low churn rate is attributable in part to the
quality and coverage of Verizon Wireless’ network and the success of retention
programmes such as the ‘Worry Free Guarantee®’, which includes the ‘New Every
Two®’ plan.
In local currency, the Group’s share of Verizon Wireless’ operating profit before goodwill
amortisation increased by 28%, which reflects increased ARPU and further cost
efficiencies. Verizon Wireless has achieved sustained cost containment, including the
reduction of interconnection and leased line rates as well as other operating expense
efficiencies.
Verizon Wireless launched V CASTSM,the first wireless consumer multimedia
broadband service in the US, in February 2005 and BroadbandAccess, a data card
product providing wide area broadband computer connectivity, in October 2003. Both
of these broadband offerings are delivered over Verizon Wireless’ Evolution-Data
Optimized wide-area network which reached a population of 75 million people at
31 December 2004 and has been growing steadily, with the intention to cover
150 million people by the end of 2005.
Vodafone and Verizon Wireless are engaged in a number of joint projects to bring
global services to their customers. Global Phone, which was launched last year, is the
first device to incorporate CDMA and GSM technology and allows Verizon Wireless
customers to use their phone in more than 100 countries. An additional joint project
enabled Verizon Wireless customers to send text messages internationally to customers
of participating GSM carriers. Vodafone and Verizon Wireless have also signed joint
contracts with key media companies for their content and have several initiatives
underway to further improve their service to multinational corporations.
Verizon Wireless has recently strengthened its spectrum position substantially with the
closing of the purchase of several key spectrum licences, including licences from
NextWave and Qwest and its participation in the FCC’s Auction 58, which ended in
February 2005.
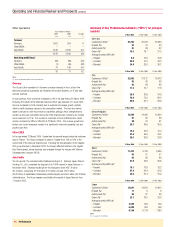
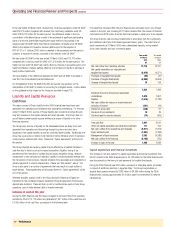
Asia Pacific
Years ended 31 March Local currency
2005 2004 Change change
£m £m % %
Turnover
Japan 7,396 7,850 (6) (2)
Other Asia Pacific 1,142 1,052 9
Less: intra-segment
turnover (7) (6) 17
8,531 8,896 (4)
Operating profit(2)(3)
Japan 758 1,045 (27) (25)
Other Asia Pacific 192 167 15
950 1,212 (22)
Japan trading results
Voice services 4,404 4,790 (8) (4)
Data services 1,206 1,350 (11) (7)
Total service revenue 5,610 6,140 (9) (5)
Net other revenue 21 2059
Interconnect costs (482) (519) (7) (4)
Other direct costs (251) (414) (39) (37)
Net acquisition costs (641) (677) (5) (2)
Net retention costs (716) (607) 18 23
Payroll (186) (186) – 4
Other operating
expenses (1,380) (1,519) (9) (5)
Depreciation and
amortisation(2) (1,217) (1,193) 2 6
Operating profit(2) 758 1,045 (27) (25)
Notes:
(1) Turnover for Japan includes revenue of £1,765 million (2004: £1,690 million) which has been excluded from other revenue
and deducted from acquisition and retention costs in the trading results.
(2) Before goodwill amortisation
(3) Before exceptional items