Vodafone 2005 Annual Report Download - page 82
Download and view the complete annual report
Please find page 82 of the 2005 Vodafone annual report below. You can navigate through the pages in the report by either clicking on the pages listed below, or by using the keyword search tool below to find specific information within the annual report.-
 1
1 -
2
-
3
-
4
-
5
-
6
-
7
-
8
-
9
-
10
-
11
-
12
-
13
-
14
-
15
-
16
-
17
-
18
-
19
-
20
-
21
-
22
-
23
-
24
-
25
-
26
-
27
-
28
-
29
-
30
-
31
-
32
-
33
-
34
-
35
-
36
-
37
-
38
-
39
-
40
-
41
-
42
-
43
-
44
-
45
-
46
-
47
-
48
-
49
-
50
-
51
-
52
-
53
-
54
-
55
-
56
-
57
-
58
-
59
-
60
-
61
-
62
-
63
-
64
-
65
-
66
-
67
-
68
-
69
-
70
-
71
-
 72
72 -
 73
73 -
 74
74 -
 75
75 -
 76
76 -
 77
77 -
 78
78 -
 79
79 -
 80
80 -
 81
81 -
 82
82 -
 83
83 -
 84
84 -
 85
85 -
 86
86 -
 87
87 -
 88
88 -
 89
89 -
 90
90 -
 91
91 -
 92
92 -
93
-
94
-
95
-
96
-
97
-
98
-
99
-
100
-
101
-
102
-
103
-
104
-
105
-
106
-
107
-
108
-
109
-
110
-
111
-
112
-
113
-
114
-
115
-
116
-
117
-
118
-
119
-
120
-
121
-
122
-
123
-
124
-
125
-
126
-
127
-
128
-
129
-
130
-
131
-
132
-
133
-
134
-
135
-
136
-
137
-
138
-
139
-
140
-
141
-
142
-
143
-
144
-
145
-
146
-
147
-
148
-
149
-
150
-
151
-
152
-
153
-
154
-
155
-
156
 |
 |

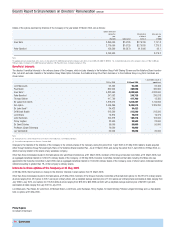
80 |Financials
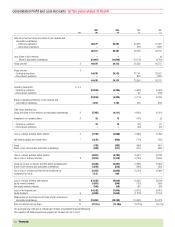
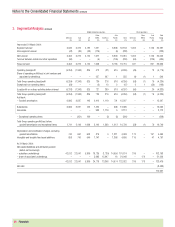
2005 2005 2004 2003
Note $m £m £m £m
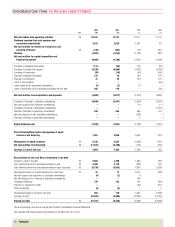
Net cash inflow from operating activities 28 24,012 12,713 12,317 11,142
Dividends received from joint ventures and
associated undertakings 3,815 2,020 1,801 742
Net cash outflow for returns on investments and
servicing of finance 28 (739) (391) (44) (551)
Taxation (3,052) (1,616) (1,182) (883)
Net cash outflow for capital expenditure and
financial investment (9,006) (4,768) (4,267) (5,359)
Purchase of intangible fixed assets (111) (59) (21) (99)
Purchase of tangible fixed assets (9,236) (4,890) (4,508) (5,289)
Purchase of investments (36) (19) (43) (546)
Disposal of tangible fixed assets 132 70 158 109
Disposal of investments 41 22 123 575
Loans to joint ventures –––(59)
Loans repaid (to)/by associated undertakings (4) (2) 24 –
Loans to businesses sold or acquired businesses held for sale 208 110 –(50)
Net cash outflow from acquisitions and disposals (3,809) (2,017) (1,312) (4,880)
Purchase of interests in subsidiary undertakings (4,648) (2,461) (2,064) (3,525)
Net cash acquired with subsidiary undertakings ––10 11
Purchase of interests in associated undertakings ––– (1,491)
Disposal of interests in subsidiary undertakings 839 444 995 125
Net cash disposed of with subsidiary undertakings ––(258) –
Disposal of interests in associated undertakings ––5 –
Equity dividends paid (3,760) (1,991) (1,258) (1,052)
Cash inflow/(outflow) before management of liquid
resources and financing 7,461 3,950 6,055 (841)
Management of liquid resources 29 6,730 3,563 (4,286) 1,384
Net cash outflow from financing 28 (11,537) (6,108) (700) (150)
Increase in cash in the year 2,654 1,405 1,069 393
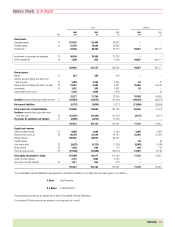
Reconciliation of net cash flow to movement in net debt
Increase in cash in the year 29 2,654 1,405 1,069 393
Cash outflow/(inflow) from decrease/(increase) in debt 29 4,099 2,170 (280) 165
Cash (inflow)/outflow from (decrease)/increase in liquid resources 29 (6,730) (3,563) 4,286 (1,384)
Decrease/(increase) in net debt resulting from cash flows 29 23 12 5,075 (826)
Net debt acquired on acquisition of subsidiary undertakings (4) (2) (7) –
Net debt disposed of on disposal of subsidiary undertakings ––194 –
Translation difference 270 143 144 (826)
Premium on repayment of debt ––(56) (157)
Other movements (8) (4) 14
Decrease/(increase) in net debt in the year 281 149 5,351 (1,805)
Opening net debt (16,032) (8,488) (13,839) (12,034)
Closing net debt 29 (15,751) (8,339) (8,488) (13,839)
The accompanying notes are an integral part of these Consolidated Financial Statements.
The unaudited US dollar amounts are prepared on the basis set out in note 1.
Consolidated Cash Flows for the years ended 31 March