Vodafone 2005 Annual Report Download - page 128
Download and view the complete annual report
Please find page 128 of the 2005 Vodafone annual report below. You can navigate through the pages in the report by either clicking on the pages listed below, or by using the keyword search tool below to find specific information within the annual report.-
 1
1 -
2
-
3
-
4
-
5
-
6
-
7
-
8
-
9
-
10
-
11
-
12
-
13
-
14
-
15
-
16
-
17
-
18
-
19
-
20
-
21
-
22
-
23
-
24
-
25
-
26
-
27
-
28
-
29
-
30
-
31
-
32
-
33
-
34
-
35
-
36
-
37
-
38
-
39
-
40
-
41
-
42
-
43
-
44
-
45
-
46
-
47
-
48
-
49
-
50
-
51
-
52
-
53
-
54
-
55
-
56
-
57
-
58
-
59
-
60
-
61
-
62
-
63
-
64
-
65
-
66
-
67
-
68
-
69
-
70
-
71
-
72
-
73
-
74
-
75
-
76
-
77
-
78
-
79
-
80
-
81
-
82
-
83
-
84
-
85
-
86
-
87
-
88
-
89
-
90
-
91
-
92
-
93
-
94
-
95
-
96
-
97
-
98
-
99
-
100
-
101
-
102
-
103
-
104
-
105
-
106
-
107
-
108
-
109
-
110
-
111
-
112
-
113
-
114
-
115
-
116
-
117
-
 118
118 -
 119
119 -
 120
120 -
 121
121 -
 122
122 -
 123
123 -
 124
124 -
 125
125 -
 126
126 -
 127
127 -
 128
128 -
 129
129 -
 130
130 -
 131
131 -
 132
132 -
 133
133 -
 134
134 -
 135
135 -
 136
136 -
 137
137 -
 138
138 -
139
-
140
-
141
-
142
-
143
-
144
-
145
-
146
-
147
-
148
-
149
-
150
-
151
-
152
-
153
-
154
-
155
-
156
 |
 |

Notes to the Consolidated Financial Statements continued
126 |Financials
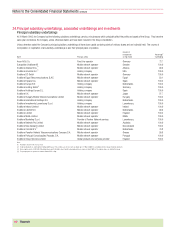
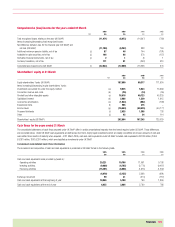
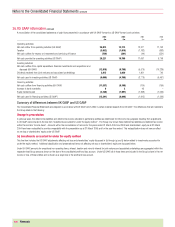
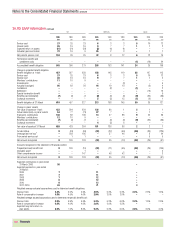
36.US GAAP information continued
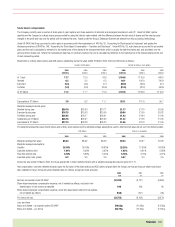
A reconciliation of the consolidated statements of cash flows presented in accordance with UK GAAP format to a US GAAP format is set out below.
2005 2005 2004 2003
$m £m £m £m
Operating activities:
Net cash inflow from operating activities (UK GAAP) 24,012 12,713 12,317 11,142
Taxation (3,052) (1,616) (1,182) (883)
Net cash outflow for returns on investments and servicing of finance (739) (391) (44) (551)
Net cash provided by operating activities (US GAAP) 20,221 10,706 11,091 9,708
Investing activities:
Net cash outflow from capital expenditure, financial investments and acquisitions and
disposals (UK GAAP) (12,815) (6,785) (5,579) (10,239)
Dividends received from joint ventures and associated undertakings 3,815 2,020 1,801 742
Net cash used in investing activities (US GAAP) (9,000) (4,765) (3,778) (9,497)
Financing activities:
Net cash outflow from financing activities (UK GAAP) (11,537) (6,108) (700) (150)
Increase in bank overdrafts 6343 –
Equity dividends paid (3,760) (1,991) (1,258) (1,052)
Net cash used in financing activities (US GAAP) (15,291) (8,096) (1,915) (1,202)
Summary of differences between UK GAAP and US GAAP
The Consolidated Financial Statements are prepared in accordance with UK GAAP, which differ in certain material respects from US GAAP. The differences that are material to
the Group relate to the following:
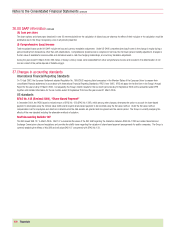
Change in presentation
In previous years, the deferred tax liabilities and deferred tax income allocable to partnership entities (as determined for US income tax purposes) resulting from adjustments
to US GAAP were included in the line item “Investments accounted for under the equity method”. The Group now shows these deferred tax liabilities and deferred tax income
within the line item “Income taxes”. Amounts within the reconciliations of net loss for the years ended 31 March 2004 and 2003 and shareholders’ equity as at 31 March
2004 have been reclassified to provide comparability with the presentation as at 31 March 2005 and for the year then ended. This reclassification does not have an effect
on net loss or shareholders’ equity under US GAAP.
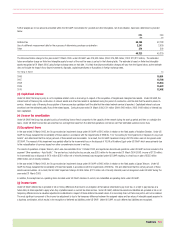
(a) Investments accounted for under the equity method
This line item includes the US GAAP adjustments affecting net loss and shareholders’ equity discussed in (b) through (g) and (j) below related to investments accounted for
under the equity method. Additional classification and presentational items not affecting net loss or shareholders’ equity are discussed below.
Under UK GAAP, amounts for exceptional non-operating items, interest, taxation and minority interest for joint ventures and associated undertakings are aggregated within the
respective total Group amounts shown on the face of the consolidated profit and loss account. Under US GAAP, all of these items are included in the Group’s share in the net
income or loss of these entities and is shown as a single line in the profit and loss account.