Vodafone 2005 Annual Report Download - page 40
Download and view the complete annual report
Please find page 40 of the 2005 Vodafone annual report below. You can navigate through the pages in the report by either clicking on the pages listed below, or by using the keyword search tool below to find specific information within the annual report.-
 1
1 -
2
-
3
-
4
-
5
-
6
-
7
-
8
-
9
-
10
-
11
-
12
-
13
-
14
-
15
-
16
-
17
-
18
-
19
-
20
-
21
-
22
-
23
-
24
-
25
-
26
-
27
-
28
-
29
-
 30
30 -
 31
31 -
 32
32 -
 33
33 -
 34
34 -
 35
35 -
 36
36 -
 37
37 -
 38
38 -
 39
39 -
 40
40 -
 41
41 -
 42
42 -
 43
43 -
 44
44 -
 45
45 -
 46
46 -
 47
47 -
 48
48 -
 49
49 -
 50
50 -
51
-
52
-
53
-
54
-
55
-
56
-
57
-
58
-
59
-
60
-
61
-
62
-
63
-
64
-
65
-
66
-
67
-
68
-
69
-
70
-
71
-
72
-
73
-
74
-
75
-
76
-
77
-
78
-
79
-
80
-
81
-
82
-
83
-
84
-
85
-
86
-
87
-
88
-
89
-
90
-
91
-
92
-
93
-
94
-
95
-
96
-
97
-
98
-
99
-
100
-
101
-
102
-
103
-
104
-
105
-
106
-
107
-
108
-
109
-
110
-
111
-
112
-
113
-
114
-
115
-
116
-
117
-
118
-
119
-
120
-
121
-
122
-
123
-
124
-
125
-
126
-
127
-
128
-
129
-
130
-
131
-
132
-
133
-
134
-
135
-
136
-
137
-
138
-
139
-
140
-
141
-
142
-
143
-
144
-
145
-
146
-
147
-
148
-
149
-
150
-
151
-
152
-
153
-
154
-
155
-
156
 |
 |

Operating and Financial Review and Prospects continued
38 |Performance
improved customer satisfaction contributed to local currency service revenue growth of
over 20%, despite a reduction in termination rates of 10.5% on 1 November 2004
required by the regulator.
In local currency, turnover increased by 24%, due principally to a 22% increase in
service revenue. A successful customer acquisition strategy, including a focus on
customers transferring from other operators, led to an 11% increase in the average
customer base. Loyalty programmes and promotional activity resulted in a reduction in
churn levels from 23.6% for the year ended 31 March 2004 to 21.9% for the 2005
financial year. An ongoing marketing campaign encouraging customers to switch from
prepaid to contract contributed to the proportion of contract customers rising from 43%
at 31 March 2004 to 47% at 31 March 2005. This, along with usage stimulation
promotions and initiatives, has resulted in a 10% increase in ARPU.
Non-voice service revenue for the year increased by 46%, with messaging remaining
the principal driver of the increase. Text messaging volumes increased 27% year on
year, primarily due to promotions stimulating increased messaging per customer. The
success of service offerings such as Vodafone live! and Vodafone Mobile Connect data
cards led to non-messaging data revenue increasing by 201% in local currency to £65
million. The number of Vodafone live! active devices rose to 2,992,000.
Strong growth in customer additions, principally in the first half of the year relative to
the previous financial year, and the increased proportion of new contract customers, led
to increased acquisition costs. Interconnect costs increased due to higher usage offset
by the impact of the termination rate cut in November and promotions in the second
half of the year focusing on calls to other Vodafone and fixed-line numbers, which incur
relatively lower interconnect costs. Operating profit before goodwill amortisation was
impacted by the increased acquisition costs and the rise in depreciation and
amortisation charges mainly due to the commencement of 3G services.
Other EMEA subsidiaries
Controlled venture customers for the Group’s operations in the Other EMEA region,
other than Spain, increased by 12% in the year to 31 March 2005.
Turnover increased by 8%, with the primary driver being an 8% increase in service
revenue, as a result of the 12% higher average controlled venture customer base,
partially offset by cuts in termination rates across the region. Non-voice service
revenue grew strongly over the prior financial year to represent 13.2% of service
revenue for the year ended 31 March 2005. In Greece, local currency service revenue
grew by 14% due to a 4% increase in the average customer base, higher voice usage
and a strong rise in non-voice service revenue. Visitor revenue also increased due to a
national roaming agreement with Greece’s fourth mobile operator and high usage
during the Olympic Games. Service revenue growth in Portugal was 11% in local
currency, driven by a 7% increase in the average customer base and good
improvements in non-voice revenue and visitor revenue, due in part to the UEFA Euro
2004 football tournament and a particularly strong start in 3G, partially offset by lower
termination rates. Service revenue in Ireland increased by 10%, in local currency,
primarily as a result of additional voice usage. Intense competition restricted growth in
local currency service revenue in the Netherlands to 1% and contributed to a 4%
decline in Sweden.
Operating profit before goodwill amortisation increased by 7% over the prior financial
year, following increased turnover partially offset by higher depreciation charges,
primarily due to the launch of 3G services.
On 12 January 2005, the Group completed the acquisition of the remaining 7.2%
shareholding in Vodafone Hungary from Antenna Hungaria Rt. with the effect that
Vodafone Hungary became a wholly-owned subsidiary of the Group. On 26 January
2005, Telecom Egypt acquired a 16.9% stake in Vodafone Egypt from the Group,
reducing the Group’s controlling stake to 50.1%. The transaction followed the reaching
business segment, there were strong sales of Vodafone Mobile Connect 3G/GPRS data
cards.
Operational efficiencies and market effectiveness were achieved in the UK from the
execution of the structured plan announced in the prior financial year. The key
elements of this plan are to sustainably differentiate and segment the customer base
allowing more effective targeted marketing and to drive lower costs whilst positioning
the organisation for the future. Under the drive to lower costs, Vodafone has continued
to consolidate call centres, simplify its network and IT platforms and reduce support
costs.
Net other revenue and other direct costs both increased as a result of non-Vodafone
customers acquired as part of service provider acquisitions in the prior year. Other
direct costs increased further due to higher content costs associated with the increased
data revenue.
Operating profit before goodwill amortisation and exceptional items was impacted by
an increase in both depreciation and licence amortisation charges, primarily due to the
commencement of 3G services towards the end of the previous financial year.
Recent independently-audited tests have shown that Vodafone has the best call
success rate of all mobile networks in Britain.
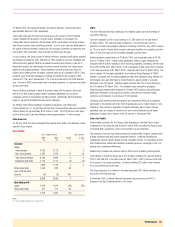
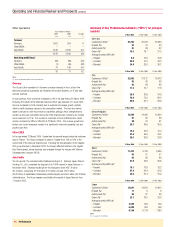
Other Europe, Middle East and Africa
Years ended 31 March Local currency
2005 2004 Change change
£m £m % %
Turnover
Spain 3,261 2,686 21 24
Other EMEA 5,402 4,983 8
Less: intra-segment
turnover (49) (42) 17
8,614 7,627 13
Operating profit(2)(3)
Spain 775 703 10 12
Other EMEA 2,608 2,439 7
3,383 3,142 8
Spain trading results
Voice services 2,558 2,191 17 19
Data services 405 282 44 46
Total service revenue 2,963 2,473 20 22
Net other revenue 23 (33) (22)
Interconnect costs (540) (477) 13 15
Other direct costs (263) (201) 31 33
Net acquisition costs (246) (146) 68 71
Net retention costs (172) (137) 26 27
Payroll (138) (146) (5) (3)
Other operating
expenses(3) (473) (393) 20 22
Depreciation and
amortisation(2) (358) (273) 31 33
Operating profit(2)(3) 775 703 10 12
Notes:
(1) Turnover for Spain includes revenue of £296 million (2004: £210 million) which has been excluded from other revenue and
deducted from acquisition and retention costs in the trading results.
(2) Before goodwill amortisation.
(3) Before exceptional items.
Spain
In Spain, Vodafone continued to deliver strong growth throughout the year. A focus on
acquiring high value customers, targeted promotions encouraging increased usage and